| Issue |
A&A
Volume 703, November 2025
|
|
|---|---|---|
| Article Number | A82 | |
| Number of page(s) | 13 | |
| Section | Extragalactic astronomy | |
| DOI | https://doi.org/10.1051/0004-6361/202555796 | |
| Published online | 07 November 2025 | |
ALMA 3 mm polarimetry of radio-quiet active galactic nuclei
1
Instituto de Estudios Astrofísicos, Facultad de Ingeniería y Ciencias, Universidad Diego Portales, Av. Ejército Libertador 441, Santiago, Chile
2
Max-Planck-Institut für Radioastronomie, Auf dem Hügel 69, Bonn D-53121, Germany
3
Kavli Institute for Astronomy and Astrophysics, Peking University, Beijing 100871, China
4
INAF, Istituto di Radioastronomia di Bologna, Via Piero Gobetti 101 40129 Bologna, Italy
5
Physics Department, Technion, Haifa 32000, Israel
6
Joint ALMA Observatory, Avenida Alonso de Cordova 3107, Vitacura, Santiago 7630355, Chile
7
Department of Earth and Space Science, Osaka University, 1-1 Machikaneyama, Toyonaka 560-0043, Osaka, Japan
8
Kavli Institute for Particle Astrophysics & Cosmology (KIPAC), Stanford University, Stanford, CA 94305, USA
9
School of Mathematics, Statistics and Physics, Newcastle University, Newcastle upon Tyne NE1 7RU, UK
10
Department of Space, Earth and Environment, Chalmers University of Technology, SE-412 96 Gothenburg, Sweden
11
Eureka Scientific, 2452 Delmer Street Suite 100, Oakland, CA 94602-3017, USA
12
Space Science Institute, 4750 Walnut Street, Suite 205, Boulder, Colorado 80301, USA
13
Department of Astronomy, University of Maryland, College Park, MD 20742, USA
14
Joint Space-Science Institute, University of Maryland, College Park, MD 20742, USA
15
National Radio Astronomy Observatory, Charlottesville VA 22903, USA
16
Department of Astronomy, University of Florida, Gainesville, FL 32611, USA
17
Department of Astronomy, University of Virginia, Charlottesville, VA 22904, USA
⋆ Corresponding author: This email address is being protected from spambots. You need JavaScript enabled to view it.
Received:
3
June
2025
Accepted:
5
September
2025
Abstract
The compact millimeter emission ubiquitously found in radio-quiet active galactic nuclei (RQ AGNs) exhibits properties consistent with synchrotron radiation from a small region (≤1 light day) and undergoing self-absorption below ∼100 GHz. Several scenarios have been proposed for its origin, including an X-ray corona, a scaled-down jet, or outflow-driven shocks, which can be tested via millimeter polarimetry. In the optically thin regime, synchrotron emission is expected to show polarization up to ∼70%, but disordered magnetic fields and Faraday rotation reduce this to a few percent for jets and outflows, while an X-ray corona is likely to result in complete depolarization. To investigate this, we conducted the first ALMA Band 3 full-polarization observations of three RQ AGNs – NGC 3783, MCG 5–23–16, and NGC 4945. No polarized signal was detected in any of the AGNs, with an upper limit of 0.5–1.5%, supporting the X-ray corona scenario. However, we detected a compact source with 17% polarization in NGC 3783, 20 pc away from the AGN, co-spatial with the millimeter and narrow-line outflow, likely linked to a shock propagating through the outflowing material. Additionally, combining our data with archival ALMA observations, we found typical millimeter variability in RQ AGNs by a factor of 2.
Key words: techniques: polarimetric / galaxies: active / submillimeter: galaxies
© The Authors 2025
 Open Access article, published by EDP Sciences, under the terms of the Creative Commons Attribution License (https://creativecommons.org/licenses/by/4.0), which permits unrestricted use, distribution, and reproduction in any medium, provided the original work is properly cited.
This article is published in open access under the Subscribe to Open model.
Open Access funding provided by Max Planck Society.
1. Introduction
The class of radio-quiet active galactic nuclei (AGNs) represents ∼90% of all observed AGNs (e.g., Kellermann et al. 1989; Ivezić et al. 2002). However, drawing a clear boundary between radio-quiet (RQ) and radio-loud (RL) AGNs can be challenging in practice, as even RQ objects often exhibit faint radio emission. Its origin is currently under active debate (e.g., Panessa et al. 2019), with various mechanisms proposed, including nuclear star formation, thermal free-free emission, and compact synchrotron sources. Notably, radio emission in AGNs has been found to correlate with X-ray emission (Laor & Behar 2008; Panessa et al. 2015), similar to that observed in coronally active stars (Guedel & Benz 1993).
The nature of high-frequency radio emission, particularly in the millimeter (mm) range, remains even more enigmatic. Historically, the spectral region near 100–300 GHz has received limited attention (e.g., Hickox & Alexander 2018), but recent studies over the past decade have revealed unresolved mm emission located at the center in the majority of RQ AGNs (∼92% according to Kawamuro et al. 2022, or 94 % according to Ricci et al. 2023). This mm emission demonstrates an even tighter correlation with X-ray emission than lower-frequency radio (Kawamuro et al. 2022; Ricci et al. 2023). Inoue & Doi (2018) found that RQ AGNs exhibit an excess of mm emission that cannot be extrapolated from lower-frequency radio data. The spectral shape of this excess aligns well with synchrotron radiation impacted by self-absorption, with a turnover frequency near 100 GHz. This turnover frequency suggests a very compact emitting region; modeling provides estimates of the source size of ∼40–50 gravitational radii (Rg), a scale similar to that of the accretion disk corona (Inoue & Doi 2018). The compactness of the mm-emitting region is further supported by observations of rapid, significant variability (Shablovinskaya et al. 2024), which imply an upper limit of about 1 light-day in size and effectively rule out emission mechanisms such as thermal emission from dust or free–free emission, which cannot account for such rapid variations.
Given the combined characteristics – compact size, correlation between mm and X-ray, and spectral shape – the most likely emission mechanism appears to be synchrotron radiation produced by the population of nonthermal electrons associated with the X-ray corona in AGNs. However, the lack of correlated variability between the mm and X-ray bands (Behar et al. 2020; Petrucci et al. 2023), even in high-resolution, high-cadence observations (Shablovinskaya et al. 2024), raises further questions about the nature of the mm emission. While the synchrotron mechanism remains the most plausible origin, the exact source is still under debate. In addition to compact size, the source should contain a magnetic field and a population of nonthermal electrons. Beyond the X-ray corona, where these conditions are expected to occur (see Inoue & Doi 2014), other possible origins include scaled-down jets or shocks within AGN outflows (see Kawamuro et al. 2022; Shablovinskaya et al. 2024, for further discussion).
To date, various observational approaches, including spectral shape analysis, variability studies, and X-ray and mm correlations, have been employed to reveal the properties of the mm-emitting source and definitively pinpoint its origin (e.g., Behar et al. 2015; Inoue & Doi 2014; Kawamuro et al. 2023). Given that synchrotron emission should be initially highly polarized, investigating the polarimetric properties of mm emission shows a promising avenue for uncovering its nature. In this manuscript, we explore the polarimetric characteristics of compact mm emission in RQ AGNs, beginning with an examination of the expected polarization signatures from different synchrotron sources. To test these predictions, we conducted the first-ever mm polarimetric survey of a sample of RQ AGNs, all of which exhibit compact mm emission (Kawamuro et al. 2023; Ricci et al. 2023), observed at frequencies close to the expected synchrotron turnover. This study aims to shed new light on the mechanisms driving mm emission in RQ AGNs and contribute to a more comprehensive understanding of its origins.
2. Expected levels of mm polarization
The most likely mechanism responsible for mm emission in RQ AGNs is synchrotron radiation from a compact source. While the most plausible scenario is the X-ray corona, other possibilities include a scaled-down jet or a shock in the outflow. Observing mm emission near the turnover frequency or at higher frequencies may allow us to detect synchrotron radiation in the optically thin regime. In cases where synchrotron emission occurs in an optically thin medium with a strong, ordered magnetic field, the polarization degree (PD) depends solely on the power-law energy distribution of nonthermal electrons, which can be described by  , where E is the electron energy and γ is the electron index. Then the linear polarization should be observed with a degree equal to
So, for typical values of γ between 2 and 3, the PD is up to ∼70% (Le Roux 1961; Rybicki & Lightman 1979). In this scenario, the PD is wavelength-independent and oriented perpendicular to the magnetic field1.
2.1. Beam depolarization
In reality, synchrotron emission experiences significant depolarization. The primary cause is beam depolarization, which occurs due to variations in the magnetic field direction within a source that is more compact than the angular resolution limit. This effect can arise from specific magnetic field configurations, such as a toroidal field, or from extreme disorder in the field structure. In the latter case, the synchrotron source can be modeled as consisting of Nc cells with randomly oriented magnetic fields, leading to a decrease in the total PD as  . Since all emission sources considered here are expected to be nonuniform due to turbulence (as in jets, e.g., Marscher 2014), magnetic reconnection (in jets, e.g., Lyutikov 2003, or coronae, e.g., Merloni & Fabian 2001), or other instabilities, depolarization should inevitably occur. However, its exact impact cannot be reliably estimated without knowing the structure of the emitting region.
2.2. Faraday depolarization
Another important mechanism of depolarization, especially in the radio band, is Faraday depolarization. The polarization plane of the emission passing through a medium of thermal electrons in the presence of a magnetic field is rotated. The same rotation occurs in the case of the external Faraday effect, where the emission source and the magnetized medium are spatially separated, and for the internal Faraday effect, where they are co-spatial. Faraday rotation can be described by the following rotation measure (RM):
which depends on the thermal electron density  (in cm−3) and the magnetic field strength B (in Gauss), with only the magnetic field component along the line of sight being relevant. In general,
  and B are functions of the path r (in cm) traveled by the radiation within a medium of size R. The resulting polarization angle rotation is then given by

where λ is the observed wavelength.
In the case of internal Faraday rotation, synchrotron radiation is produced in different regions of a finite-sized source, where the medium contains a magnetic field. As a result, the radiation traverses different path lengths within the source, leading to varied rotation angles. This causes depolarization of the observed total emission (Gardner & Whiteoak 1966). The depolarization factor, i.e., the ratio of observed to intrinsic polarization PDobs/PDint, is a function of RM and λ2, which depends on the source geometry and medium uniformity. The simplest model is a uniform, symmetric slab (Burn 1966; Sokoloff et al. 1998), which can be applied both to the corona (e.g., Raginski & Laor 2016), jets, and outflows (e.g., Yushkov et al. 2024). In this case, depolarization is given by
 (1)
(1)
Complete depolarization occurs when λ2RM =kπ for the integer k, although this condition varies for different types of slabs (see Sokoloff et al. 1998). In some slab types and in a spherically symmetric source, full depolarization does not occur at all (see Burn 1966). However, for most configurations (except for anomalous “reversed” depolarization due to specific magnetic field configurations, Sokoloff et al. 1998), the observed polarization decreases significantly at sufficiently large λ2RM.
2.3. Faraday rotation in mm emitting sources
Since our observation wavelength is fixed (100 GHz, or 3 mm), we can roughly estimate RM for internal Faraday rotation for the three mm-emitting synchrotron sources we consider.
Jet. In general, a parsec-scale jet is not suitable for describing the mm excess in RQ AGNs due to its size, as a larger synchrotron-emitting region corresponds to a lower turnover frequency, which for jets is assumed to be much lower than 100 GHz. However, a compact jet may still be present in RQ AGNs, as we observe in radio maps at lower frequencies, and its material could depolarize mm emission. Faraday rotation and depolarization have indeed been observed in jets, including with ALMA, with characteristic RMs in the range of 103 − 105 rad m−2 (e.g., Goddi et al. 2021; Peng et al. 2024). Even with relatively low electron densities (∼10−2 cm−3) and magnetic field strengths of 0.1 − 10 G (O’Sullivan & Gabuzda 2009; Hovatta et al. 2019), these RMs result in significant polarization suppression. For example, at 3 mm, RM is typically up to 4 × 10⁴ rad m−2, and in extreme cases, RMs can reach 5 × 10⁵ rad m−2 at 1.3 mm (Hovatta et al. 2019), reducing synchrotron polarization to ∼1–2%.
Outflow. When considering AGN warm ionized outflows, we assume they consist mainly of thermal electrons, which produce unpolarized emission due to free-free radiation processes. However, shocks can occur in these outflows, compressing both the material and the magnetic field, thus increasing their density. Such processes may induce a low level of polarization around 7% (as in NGC 1068, Lopez-Rodriguez et al. 2020). However, due to the compact size of the shock fronts, they are unlikely to produce significant internal Faraday rotation. The thermal medium in the outflow could contribute to depolarization, but this effect is expected to be minor: with an average particle density of ∼102 − 103 cm−3 (Davies et al. 2020)2 and a relatively weak magnetic field3, even a parsec-scale outflow would have an RM around ∼105 rad m−2. Consequently, we can still observe a polarization level of a few percent in these cases.
Corona. The corona in AGNs is highly compact, with a size estimated to be less than 0.001 pc (∼3 ×1015 cm) from microlensing measurements of mm-emitting source (Rybak et al. 2025), or confined to the region 1–100 Rg (∼3 ×10¹²–3 × 1014 cm) for slab geometry in modeling of the X-ray data via ray tracing (Marinucci et al. 2019; Gianolli et al. 2023). The corona consists mostly of hot (Te ∼ 109 K) thermal electrons with only a few percent (∼1–5%, Inoue et al. 2008; Inoue & Doi 2014) of nonthermal electron population. The electron density  within the corona is thought to be less than 1010 cm−3 (Haardt & Maraschi 1993). It can be estimated from the optical depth τ and the corona size L:
  , where σT = 6.65 × 10⁻²⁵ cm2 is the Thomson cross section. Concerning the median estimate of τ ≈ 0.25 (Ricci et al. 2018), we can estimate the density as ∼109–1011 cm−3. For B ≈ 1 − 10 G (Laor & Behar 2008), the RM reaches up to ∼1011 rad m−2, leading to extreme depolarization according to Eq. (1), with an undetectable PD less than 10−8%.
Additionally, for such extreme RM values, depolarization also occurs due to the finite bandwidth of the observations. If the rotation is so large that within the bandwidth the polarization angle χ rotates by more than π, the measured polarization will effectively average to zero. Thus, the maximum measurable RM in observations at a frequency ν = c/λ with a bandwidth Δν is constrained by
For observations at 100 GHz with Δν = 2 GHz, the maximum measurable RM ≈9 × 10⁶ rad m−2.
Thus, if there is a jet or outflow with a compact source of synchrotron emission passing through its medium, we are likely to detect polarization at a fairly low level, on the order of a few percent. In the case of a corona, however, the observed polarization will be strictly zero.
3. Sample, observations and data reduction
To investigate the polarimetric properties of mm emission, we selected RQ AGNs from a volume-limited sample (< 50 Mpc), which has been observed before at 100 GHz by ALMA with < 100 mas resolution (Ricci et al. 2023). All of these AGNs showed unresolved nuclear emission with resolutions down to 0 05–0
05–0 1. From the sample from Ricci et al. (2023), we chose the three brightest sources at 100 GHz, selecting objects of different AGN types and covering the widest possible range of column densities. This selection was designed to ensure a variety of inclination angles, allowing us to investigate both potential absorption effects in external AGN structures and to observe different magnetic field projections. Finally, we chose the following three RQ AGNs: NGC 3783, MCG 5–23–16, and NGC 4945. The properties of the AGNs are summarized in Table 1.
Sample of RQ AGNs.
The ALMA Band 3 observations were conducted in October 2023 (2023.1.01517.S; PI C. Ricci), during the ALMA long baseline configuration (C-8), with the longest baseline extending to 8.5 km. The observation dates, time spent on the sources, and the beam sizes of the obtained images are summarized in Table 2. The spectral setup was the default frequency setup for polarization continuum observations, maximizing the sensitivity, with four spectral windows (1.985 GHz wide) divided into 64 channels, at 90.52, 92.48, 102.52, and 104.48 GHz.
ALMA Band 3 observation log.
Data processing was carried out using CASA version 6.5.4.9 and ALMA Pipeline version 2023.1.0.124 (Hunter et al. 2023). The clean images were generated using CASA task tclean with weighting = briggs (robust = 0.5). According to the ALMA Proposer’s Guide, the systematic flux error for Band 3 observations is 5%. Flux measurements from the polarization calibrators, as well as the check sources, yielded consistent results, justifying the application of a 5% error margin in our analysis. Furthermore, the estimated degree and angle of polarization for the calibrators were consistent with the measurements from the AMAPOLA calibrator monitoring4.
For each epoch, we created maps of the Stokes parameters I, Q, U, and V. Circular polarization was not detected in the maps and was therefore assumed to be zero, as it is typically weak at mm wavelengths. The polarized intensity was thus calculated as
where Q and U are the Stokes parameters in units of flux. The PD was then calculated as PD = P/I × 100%, where I is the total intensity, and de-biased following the method outlined in Montier et al. (2015a,b). In cases where the polarization is undetected, we estimated the upper limit of the PD:
where σQ and σU are the standard deviation of the Stokes Q and U, respectively, and I corresponds to the peak total intensity, ensuring that PDlim is evaluated at the position of maximum signal-to-noise ratio in the image.
4. Results
4.1. NGC 3783
In the Seyfert 1 galaxy NGC 3783, we measured a peak mm flux of 2.01 ± 0.10 mJy from the central region, where the AGN is expected to reside, with no detectable variability over nearly two hours of observations. As the data were obtained with a significant on-source integration time and an angular resolution of 0 1 (∼18.4 pc), we find that the mm continuum source appears slightly extended to the north (Fig. 1, upper panel), but this extended emission is faint, at the ∼0.1–0.2 mJy/beam level, and does not contribute substantially to the total flux, which remains dominated by the compact central source. The in-band spectral index of the AGN emission, calculated across four spectral windows assuming Fν ∝ να, corresponds to α = −0.92 ± 0.40. The maps of polarized intensity and PD (Fig. 1, middle and bottom panel, respectively) showed no polarized signal in the AGN location, where the mm intensity also peaks, giving just an upper limit of PDlim = 1.2%.
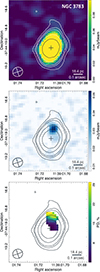 |
Fig. 1. ALMA observations of NGC 3783. Upper panel: Total intensity with the contours corresponding to the 2, 4, 6, 18, and 50σ levels (1σ = 0.007 mJy/beam) in the box ∼0.9 × 0.9″. The location of the AGNs according to Gaia DR3 (Gaia Collaboration 2023) is marked with a black cross. Middle panel: Polarized intensity with the overplotted total intensity contours. Bottom panel: Polarization degree in percent. The areas with a signal-to-noise ratio of < 5 on the total intensity map are masked. |
Nevertheless, we detected polarized emission offset to the north from the AGN, along the extended structure. The maximum of the total intensity and the maximum of the polarized intensity are separated by ∼0 11, which corresponds to the resolution limit of the data and a projected distance of ∼20.2 pc. This confirms that the polarization does not originate from the AGN itself. The offset mm emission exhibits a total flux of ∼0.3 mJy and a PD of 17% ± 2%, with the polarization angle oriented at 10° ± 3°. The in-band spectral index of total intensity in the region exhibiting polarized emission is extremely steep, −3.6 ± 2.4, though the large uncertainty significantly limits the robustness of this measurement.
4.2. MCG 5–23–16
The observations of type 1.9 AGN MCG 5–23–16 revealed a slightly extended structure, with most of the intensity concentrated in the central compact source (Fig. 2, upper panel). We measured the flux 2.54 ± 0.13 mJy peaking in the position of the AGN, with no variability during the observing period. The mm emission showed an in-band spectral index α = −0.42 ± 0.40. The total intensity map indicates a slightly resolved structure, oriented along a position angle (PA) of about −20° to 189° (north-south direction), with the southern lobe extending further, reaching ∼0 3 (∼52 pc).
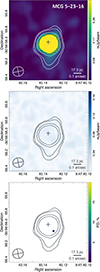 |
Fig. 2. ALMA observations of MCG 5–23–16. Upper panel: Total intensity with the contours corresponding to the 4, 6, 19, and 37σ levels (1σ = 0.010 mJy/beam) in the box ∼1 × 1″. The location of the AGNs according to Gaia DR3 (Gaia Collaboration 2023) is marked with a black cross. Middle panel: Polarized intensity with the overplotted total intensity contours. Bottom panel: Polarization degree in percent. The areas with a signal-to-noise ratio of < 5 on the total intensity map are masked. |
The polarized intensity and PD maps are given in the middle and bottom panels of Fig. 2. No polarization was detected in this object, with an upper limit of PDlim = 1.5%.
4.3. NGC 4945
NGC 4945, a Seyfert 2 galaxy with a nuclear starburst, is known for hosting numerous mm sources in its central region, previously identified as star clusters (Emig et al. 2020), inside the extended (> 10″) mm continuum structure reproduced by combining dust thermal emission and free-free emission (Bendo et al. 2016). This complex structure was also observed in our Band 3 observations. Additionally, we find a highly polarized mm source at a projected distance of ∼3 4 from the nucleus, as reported in Shablovinskaia et al. (2025). Although the surrounding material contributes significantly to the mm emission of the galaxy, the central compact AGN-associated source stands out as the brightest in the high-resolution data.
This galaxy was observed twice, with the sessions separated by 14 days. Despite formally insufficient parallactic angle coverage during the first session (51.12° instead of the desired 60.00°) to reliably constrain instrumental polarization leakage and accurately recover the intrinsic polarization angle (see details in, e.g., Nagai et al. 2016; Martí-Vidal et al. 2016), it was deemed close enough to allow flux and polarization estimates. The measured fluxes were consistent across both epochs, with 9.14 ± 0.46 mJy in the first session and 8.82 ± 0.44 mJy in the second, aligning well with previous measurements (8.1 mJy, Ricci et al. 2023). The spectral index remained stable as well, with α = −1.06 ± 0.40 and α = −1.29 ± 0.40 for the two epochs, respectively. Note that, despite exhibiting the highest mm flux among the objects in our sample, NGC 4945 has an mm luminosity that is ∼25 times lower, setting it apart from the other two in our study. This significant difference in luminosity likely causes the host galaxy of NGC 4945 to stand out prominently in our observations, while the other two AGNs appear almostpoint-like.
Figure 3 presents the total intensity, polarized intensity, and PD maps from the first epoch. In the central region, coinciding with the AGNs and the maximum mm flux, no polarized emission was detected. The second epoch yielded similar results, and thus no additional images are shown. The estimated upper limits on polarization are low, with PDlim = 0.6% and PDlim = 0.5% for the two epochs, respectively.
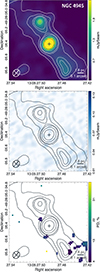 |
Fig. 3. ALMA observations of NGC 4945. Upper panel: Total intensity with the contours corresponding to the 31, 46, 55, 92, and 184σ levels (1σ = 0.016 mJy/beam) in the box ∼1.2 × 1.2″. The location of the AGNs, where mm emission peaks, is marked with a black cross. Middle panel: Polarized intensity with the overplotted total intensity contours. Bottom panel: Polarization degree in percent. The areas with a signal-to-noise ratio of < 5 on the total intensity map are masked. |
To summarize the measured properties of all AGNs in the sample, we present fluxes and luminosities at 100 GHz, in-band spectral indices, and PD limits in Table 3. Additionally, we provide 2–10 keV X-ray luminosities derived from Swift observations taken within a few weeks of the ALMA data: 27 days later for NGC 3783 (obsid 00037255022), 19 days for MCG 5–23–16 (obsid 00030839036), and 38 days for NGC 4945 (obsid 00037266008).
Measured properties of mm emission in the sample of RQ AGNs.
5. Discussion
5.1. Extended mm structure and polarization
The RQ AGNs in our sample were selected to contain a compact, unresolved mm core. Our ALMA observations in full polarization mode with significant on-source time confirm that the central compact source still dominates in each case. However, due to the high sensitivity of these observations and a signal-to-noise ratio > 200, new faint (at the level of a few percent of the peak flux) details emerge in the total intensity maps, revealing that none of the sources appear exclusively compact anymore.
Kawamuro et al. (2023) observed the same objects in ALMA Band 6 but noted extended structure only in NGC 4945, which, as discussed in Sect. 5.3 and referring to Bendo et al. (2016) and Emig et al. (2020), is due to mm-bright star-forming regions and an extended thermal dust and free–free continuum component (3″ × 14″, Kawamuro et al. 2023). The other two sources in our sample, NGC 3783 and MCG 5–23–16, which previously appeared compact (Kawamuro et al. 2023; Ricci et al. 2023), now show faint extended components at the 2–3σ level, extending several dozen parsecs from the core (see Figs. 1 and 2). Although the spatially compact central emission and the extended mm emission overlap, without kinematic information on this faint extended component, we cannot confirm whether these structures originate from AGN activity.
NGC 3783 presents a particularly intriguing case. The extended mm emission in this galaxy was not reported by Kawamuro et al. (2023) in their ALMA Band 6 observations. The ALMA archive lacks comparable observations with sufficient sensitivity and resolution to detect extended structures at the 0.1–0.2 mJy/beam level. The most important result is that our data reveal significant polarization in this region. Notably, the peak of the polarized emission is significantly offset – by more than one beam size – from the AGN position, suggesting that the polarized mm source is not directly associated with the close vicinity of the SMBH. It appears that this polarization is co-spatial with the extended mm structure. Observations in other bands confirm the presence of an outflow in the same direction. MUSE observations with ∼0 03 sky resolution indicate that the extended narrow-line region in NGC 3783 is elongated in this direction (den Brok et al. 2020), a finding corroborated by GRAVITY Collaboration (2021). This suggests that the extended mm emission may be part of an AGN-driven outflow, possibly radiating via free-free processes. In this scenario, the observed polarization could be associated with the outflow, where shocks produce synchrotron emission.
However, this hypothesis requires further investigation. First, while a shock in the outflow is plausible, the observed polarized flux (∼0.3 mJy at 100 GHz) is approximately an order of magnitude lower than that predicted by the shock-wind model presented in Yamada et al. (2024), which estimates 2 mJy at 100 GHz for a wind region size of 200 pc and a magnetic field of 0.05 mG. The discrepancy may stem from their use of low-resolution centimeter-wave radio data, likely contaminated by multiple emission components, unlike our compact detection. Second, if the polarization arises from a shock in the outflow, the observed PD at ∼17% is unexpectedly high. As discussed in Sect. 2, Faraday rotation and the turbulent nature of the shock are likely to depolarize the synchrotron radiation, typically resulting in PD values of only a few percent. Moreover, our estimate of the PD may represent a lower limit to the intrinsic polarization. The polarized source, with a total flux of ∼0.3 mJy, is located near the brighter AGN (∼2 mJy), meaning that the observed total intensity could be contaminated by the neighboring AGN emission. This would lead to an overestimation of the total flux and, consequently, an underestimation of the PD, implying that the true intrinsic PD could be even higher, which would be even more difficult to reconcile with standard shock scenarios. Confirming this interpretation will require detailed modeling of the visibility data. Nonetheless, the detection of an ∼17% polarized mm source in NGC 3783 not only demonstrates the feasibility of detecting mm polarization in RQ AGNs, but also suggests the lack of significant Faraday depolarization screen on scales smaller than ∼20 pc.
A similar challenge arises in estimating the spectral index of the polarized region. The maps of the in-band spectral index and its error are shown in Fig. 4. The maps are created for only pixels with a value exceeding 2σ at all four frequencies. As seen in the figure, the spectral index at the AGN position is approximately −0.9. In contrast, the polarized source located north of the AGN appears as a compact feature in the spectral index map, exhibiting an extremely steep in-band spectral index of −3.6 ± 2.4. Although this value is unusually steep for most knownastrophysical emission mechanisms, the large associated uncertainty limits a definitive interpretation. If real, such a slope could indicate a spectral break in the synchrotron-emitting electron population due to radiative cooling, or a high-frequency cutoff in the synchrotron spectrum related to energy losses or acceleration limits. However, given the high uncertainty, we do not draw any firm conclusions. To clarify the nature of this emission, further observations with broader spectral coverage in polarized light are crucial.
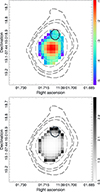 |
Fig. 4. Map of the in-band spectral index α (upper panel) and its associated error (bottom panel) of NGC 3783. Dashed contours represent the total intensity (see Fig. 1). The position of the polarized source is highlighted by a thick black contour. Note that the very steep slope in the outer regions is likely an artifact caused by the slightly narrower beam size at higher frequencies. |
5.2. Scenarios for AGN mm emission depolarization
As discussed in Sect. 2, the compact mm emission in the center of RQ AGNs is highly likely to have a synchrotron origin. The spectral indices observed for the sources in our sample (see Table 3) also confirm this: NGC 3783 and NGC 4945 show α ≈ −1, consistent with optically thin synchrotron emission. MCG 5–23–16 has a less steep index, α ≈ −0.4, which in principle does not exclude a free-free origin. However, despite the strong evidence for synchrotron emission, we do not detect any significant polarization, suggesting that extreme depolarization must be at play. The key question is which mechanism – nonuniform structure of the magnetic fields or Faraday rotation –dominates.
As discussed in Sect. 2, all plausible sources of synchrotron mm emission in AGNs – jets, shocks in outflows, and coronae – are expected to be nonuniform. These regions are likely clumpy, and if we assume that the emitting area consists of Nc independent cells, the expected synchrotron polarization, ∼70% can be suppressed as  . To reach even the highest measured upper limit of PD (1.5%), the emission region would require Nc > 2000 uncorrelated cells. Such a large number of randomly oriented emission zones would also smooth out any variability. However, as recent studies have shown, the mm emission in all observed RQ AGNs is highly variable on the time-scales of days and shorter (Behar et al. 2020; Petrucci et al. 2023; Shablovinskaya et al. 2024; Michiyama et al. 2024). This makes this mechanism alone an unlikely explanation for the observed depolarization.
To produce depolarization, the magnetic field does not need to be completely disordered. Since the compact mm emission from AGN cores is unresolved, beam depolarization can play a significant role, for example, if the synchrotron emission originates from electrons spiraling along magnetic loops. In this case, the polarization vectors rotate along the curved field lines, and when integrated over the unresolved structure, the net polarization is naturally diminished. The only way to overcome this effect is through extremely high-resolution observations. However, for coronal-scale structures, this would require angular resolutions at the microarcsec level, beyond the capabilities of even space-Earth interferometer RadioAstron (Kardashev et al. 2013) or the upcoming ngVLA.
Faraday depolarization is also an efficient depolarization mechanism. As previously discussed, even moderate Faraday rotation depths can significantly suppress polarization at mm wavelengths (see Sect. 2). The efficiency of this effect depends on the electron density and magnetic field structure along the line of sight, which vary between different potential mm-emitting components. In jets and shocks within the outflows, the Faraday depth is expected to be lower than in the dense, magnetized corona. Given the observed polarization limits, a key argument in favor of the corona scenario is that it naturally provides the conditions for strong Faraday depolarization at mm wavelengths.
In principle, this effect is testable: multifrequency polarization measurements should reveal the characteristic λ−2 dependence of PD, allowing estimates of RM. A non-detection in a narrow frequency window around 100 GHz is insufficient to constrain the origin of the depolarization. While the corona currently appears to be the most plausible source, confirming this requires polarization measurements at higher frequencies. For coronal emission expected to dominate in the 100–300 GHz range (e.g., Behar et al. 2015), a continued lack of polarization detection would imply RM values exceeding ∼108 rad m−2, significantly higher than those typically associated with jets or outflows – and thereby strongly favoring the corona as the origin of the mm emission.
5.3. Variability in mm
Besides polarization, variability could provide some insights about the mm emission origin. Here we provide a brief analysis of our archival data to explore possible flux changes that might help distinguish emission scenarios or explain depolarization. However, a detailed variability study is beyond the scope of this work.
We checked for intra-observational variability by reimaging the observations and dividing them into time intervals of tens of minutes. No source exhibited significant flux changes beyond the measurement uncertainty (assumed to be 5%). NGC 4945 also showed no detectable flux variations between the two epochs separated by 14 days.
For longer timescales, we compiled ALMA Band 3 data for all three sources. We selected observations with comparable angular resolution (less than 0 3) to minimize contamination from nearby structures. The data are presented in Fig. 5 and stored in Tables A.1, A.2, and A.3 for NGC 3783, MCG 5–23–16, and NGC 4945, respectively. The observed flux variations between epochs are a factor of 1.9 in 136 days for NGC 3783, 1.6 in 703 days for MCG 5–23–16, and 1.7 in 42 days for NGC 4945. NGC 3783 and NGC 4945 shows changes in the in-band spectral index, which remain negative, varying between −0.26 ± 0.16 and −1.34 ± 0.39 in NGC 3783, and between −0.84 ± 0.06 and −1.35 ± 0.03 in NGC 4945. Surprisingly, the archival data for MCG 5–23–16 reveals a positive spectral slope of ∼0.3. No correlation is found between flux and spectral index.
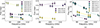 |
Fig. 5. Archival ALMA Band 3 data. Only observations with a resolution higher than 0 |

The predominantly negative spectral index in most observations supports the synchrotron origin of mm emission (Rybicki & Lightman 1979). The intensity of synchrotron emission depends on the energy density of the magnetic field (∝B2) and the kinetic energy of relativistic electrons, determined by their Lorentz factors and number density (e.g., Condon & Ransom 2016). Unstable processes such as shock waves, plasma instabilities, and magnetic reconnection can accelerate electrons (e.g., Miller 1996), thereby influencing synchrotron emission. These mechanisms also influence the local magnetic field energy, by either amplifying it or converting it into plasma heating and particle acceleration. The physical processes occurring in the corona remain uncertain and are subject to ongoing debate, but it appears that these mechanisms generally heat the plasma, potentially causing simultaneous increases in X-ray luminosity. Unfortunately, no simultaneous X-ray observations were available for our sources, preventing a direct comparison between X-ray and mm variability.
Given the sparsity of the data, it is impossible to establish a definitive variability pattern. Flux variations by a typical factor of 2 are observed across all sources, but the large time gaps between observations hinder our ability to link high and low states. More regular monitoring is needed to draw meaningful conclusions about the variability mechanisms at play.
5.4. The size of the emitting region
The absence of mm variability in any of the sources during our observations suggests that the emitting region is typically larger than one light hour. However, as shown above, the mm observations are too sparse to place stringent constraints on the size of the mm-emitting region in each source.
To derive rough constraints on the emitting region size, we follow the approach of Laor & Behar (2008), assuming that the mm emission originates from a homogeneous synchrotron source with a uniform magnetic field B and a power-law energy distribution of relativistic electrons. Additionally, we assume that the magnetic energy density is in equipartition with the photon energy density. Under these conditions, the magnetic field strength can be estimated using Eq. (21) from Laor & Behar (2008):
 (2)
(2)
where Rpc is the size of the region in pc, and Lbol is the bolometric luminosity in units of 1046 erg s−1. We calculated Lbol from the X-ray luminosity at 14–150 keV (see Table 1) considering a uniform 14–150 keV bolometric correction of 8.48 (following Ricci et al. 2023). While Lbol may overestimate the local photon energy density, we adopt it here, as in Laor & Behar (2008), assuming that the inner accretion disk dominates the radiation field. Moreover, the dependence on Lbol is weak: since the source size scales as  , even an order-of-magnitude uncertainty in the luminosity would change the estimated size by no more than ∼30%, which is negligible given the overall roughness of the assumptions. Assuming B = Beq, Eq. (19) from Laor & Behar (2008) holds:
 (3)
(3)
where Lmm is the mm luminosity in units of 1030 erg s−1 and νGHz is the observed frequency in GHz. We note that this approach uses the total coronal energy density dominated by thermal electrons, as a proxy for the energy density of the synchrotron-emitting population. While the energy content of the nonthermal electrons responsible for the mm emission is not directly constrained, this introduces some uncertainty in the inferred equipartition magnetic field and hence in the estimated source size.
According to Chen et al. (2025), a homogeneous synchrotron source of radius R produces a spectrum composed of self-absorbed emission below the turnover frequency and optically thin emission above it. This results in a flat spectral index, 0 > α > −0.5, between two turnover frequencies corresponding to the inner and outer radius of the source: ν0(Rmax) < ν < ν0(Rmin). In our sample, the mm emission at 100 GHz exhibits α < −0.5 in NGC 3783 and NGC 4945, leading to Rmin = 178 and 586 Rg, respectively, based on Eq. (3). In MCG 5–23–16, α ≈ −0.4, indicating that the emission may be transitioning between optically thin and thick regimes. For this source, Rmin = 86 Rg at 100 GHz, though if ν0(Rmin) > 100 GHz, the inner region could be even smaller. According to Eq. (2), the corresponding magnetic field strengths at Rmax are ∼116 G, ∼147 G, and ∼111 G for NGC 3783, NGC 4945, and MCG 5–23–16, respectively.
Estimating Rmax is more challenging, as it requires observations at lower frequencies to identify where the inverted spectrum transitions to a flat one. To address this, we compiled high-resolution radio data from the literature (Fig. 6; see details in Appendix B). While we aimed to include only data with angular resolution better than 1″, for frequencies at or below 1.4 GHz, only data with a resolution of approximately 1′ were available. In all cases, the low-frequency radio data (≲40 GHz) are well described by a power-law fit. However, this fit cannot be extrapolated to the mm regime, as the spectral slope at 100 GHz differs significantly. A clear mm excess is observed in NGC 3783 and MCG 5–23–16, which strongly deviates from the low-frequency power-law behavior. In contrast, for NGC 4945, the measured radio fluxes are significantly contaminated by surrounding structures. Therefore, we treat all available radio data as upper limits on the intrinsic radio emission of AGNs. As a result, the observed radio slope in NGC 4945 likely traces extended emission rather than the compact core.
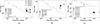 |
Fig. 6. Compilation of archival radio and ALMA data (see details in Tables B.1, B.2, and B.3): NGC 3783 (a), MCG 5–23–16 (b), and NGC 4945 (c). The radio data below 100 GHz is fit with a power law. |
The mismatch between the radio and mm regimes suggests that the spectral break between optically thick and thin regimes occurs between ∼10 and 100 GHz. Based on the radio luminosity detected at the highest frequency that follows the radio power-law, we estimated upper limits for Rmax. Using the flux at 8.6 GHz for NGC 3783, we obtained Rmax ≈ 3500 Rg, which is comparable to the broad-line region size (Bentz et al. 2021). Assuming equipartition, the corresponding magnetic field at this Rmax is ∼5 G. For MCG 5–23–16, observations exist at 36 GHz, but the emission already shows an excess compared to lower frequencies. Therefore, we used a flux at 8.46 GHz, yielding Rmax ≈ 1000 Rg, with a magnetic field strength of ∼10 G. In NGC 4945, the situation is more complex due to the lack of data to separate the AGN emission from the surrounding star-forming region. This galaxy exhibits very extended and bright radio emission compared to the other two under study (see Appendix B). However, this emission is associated with star formation, and there is no clear radio detection of the AGN in NGC 4945. Using a 1 mJy upper limit at 2.3 GHz from Lenc & Tingay (2009), we estimate Rmax ≈ 104 Rg, with a corresponding magnetic field strength of ∼8 G.
5.5. Comparison with radio-loud sources
To compare the polarimetric properties of the RQ AGNs in our sample, we examined ALMA polarization data for RL AGNs. Blazars and compact radio sources, such as flat spectrum radio quasars (FSRQs) and compact steep spectrum (CSS) sources, are known to exhibit significant mm polarization, often exceeding 10%. For example, Nagai et al. (2016) demonstrated that 3C 286, a CSS source with a compact jet, exhibits ∼17% polarization at 230 GHz. Similarly, blazars frequently show polarization levels from a few to more than 10% (see the AMAPOLA database).
To investigate RL AGNs with extended radio jets and without strong Doppler beaming, we selected non-blazar RL sources having high-resolution archival ALMA data (< 0 5). This dataset included three RL sources: NGC 1052, Cen A, and 3C 120. Additionally, we considered 3C 273, although it is an FSRQ and therefore not an ideal comparison case. However, Hovatta et al. (2019) reported that at ∼230 GHz, 3C 273 exhibits an unresolved core with a linear polarization of only 1.8%, attributed to synchrotron emission from the jet base, suggesting that Faraday depolarization may play a significant role.
NGC 1052 was observed multiple times in different bands, consistently revealing a negative spectral slope. The total intensity analysis of Band 4 and 6 data from November 2018 (2018.1.00457.S, PI: S. Kameno) shows a spectral index of −0.9 ± 0.15. Observations from May–June 2023 (2022.1.00506.S, PI: T. Davis) across Bands 3–6 indicate an even steeper spectrum with a spectral index of −1.3 ± 0.1. Despite this, no polarized signal is detected above the 0.1% calibration uncertainty in the November 2018 Band 4 and 6 data, confirming the absence of detectable mm polarization.
3C 120 was observed in Bands 4 and 6 (2017.1.01425.S, PI: T. Savolainen) with a 250-day separation. Both observations show a total intensity spectral slope of about −0.5, though the flux varies significantly (by a factor of 1.8 when extrapolated between bands). No polarized signal is detected above the 0.1% calibration uncertainty.
ALMA observed Cen A polarization four times (2013.1.01282.S, 2015.1.00421.S, PI: H. Nagai), but only in Band 7, where no polarization above 0.1% is detected. The total intensity spectra in Bands 3 and 4 (2022.1.00506.S, PI: T. Davis) follow a steep power-law index (α ≈ −0.3). However, Bands 5 and 7 do not fit this power-law, and the Band 7 flux shows significant excess, suggesting a possible contribution from another component, such as thermal dust emission.
Overall, despite their optically thin synchrotron emission, the archival ALMA polarimetric data show that RL AGNs show no polarized signal except PD ∼1.8% in 3C 273, where the polarization level is comparable to the upper limits we obtained for RQ AGNs. Faraday depolarization could be a key factor in suppressing polarization, as demonstrated for the jet base of the FSRQ 3C 273 (Hovatta et al. 2019). Magnetic field geometry may also play a role in reducing the observed polarization. A striking example is M87, where polarization at mm wavelengths reaches 15% in resolved EHT maps (Event Horizon Telescope Collaboration 2021). However, ALMA observations with 0 3 resolution show much lower polarization: PD ≈ 0.5% in Band 6 (2017.1.00608.S, PI: I. Marti-Vidal), PD ≈ 1.3% in Band 3 (2013.1.01022.S, PI: K. Asada), and PD ≈ 2.8% in Band 7 (Goddi et al. 2025). These values are comparable to the upper limits obtained for our RQ sample. Notably, our three RQ AGNs belong to different types and thus have different inclinations, which, in principle, should mitigate the impact of magnetic field configuration, whether predominantly toroidal or poloidal, on reducing the observed polarization. Nevertheless, no polarization was detected in the RQ sample.
In summary, the few RL AGNs with detected mm polarization in archival ALMA data exhibit PDs comparable to the upper limits derived for our RQ sample. The number of the studied sources remains too small to establish a clear trend; however, these findings may suggest that mm PD at the 0.5–1% level is not clearly indicative of either jet- or corona-dominated emission, at least in the currently available data. Additional insight comes from recent far-infrared polarimetric studies (Lopez-Rodriguez et al. 2023), which reveal a pronounced dichotomy: while RQ AGNs appear essentially unpolarized (PD < 1%), RL AGNs show significantly higher polarization (5–11%, including Cen A with PD ≈ 4% at 100 μm), attributed to magnetically aligned dust grains at scales of 5–130 pc. This supports the idea that a more strongly magnetized environment with a coherent field structure may be key to jet launching, and further mm polarimetric observations are needed to enable a systematic comparison between RQ and RL AGNs.
6. Conclusions
To reveal the origin and to investigate the properties of the compact mm emission ubiquitously found in RQ AGNs, we observed a sample of three mm-bright AGNs – NCG 3783, MCG 5–23–16, and NGC 4945 – with ALMA Band 3 (∼100 GHz) in full polarization mode. The new observations were deep enough to show in all three galaxies both the compact mm regions located at the position of the AGNs and unresolved at an ∼0 1 angular resolution and faint extended structures surrounding the central mm core (see upper panels in Figs. 1, 2, 3). The mm emission from all three sources shows a negative in-band spectral index, which, at least for NGC 3783 and NGC 4945 where α ≈ −1, is a sign of optically thin synchrotron emission. MCG 5–23–16 data showed α ≈ −0.4, which may indicate a transition to the optically thick synchrotron regime.
-
Despite exhibiting a negative spectral index in the mm band indicative of optically thin synchrotron emission, no polarization is detected in RQ AGNs down to a level of PD = 0.5%. The complete absence of detected polarization suggests strong depolarization. While depolarization due to a disordered magnetic field alone would require an excessive number of uncorrelated emitting regions, resulting in a smooth flux variability inconsistent with observations, the Faraday effect emerges as a more plausible mechanism. By comparing the expected impact of Faraday rotation with the obtained PDlim, we find that Faraday rotation in the X-ray corona is the most likely cause of the total depolarization of the observed mm emission (Sects. 2 and 5.2). Notably, archival high-resolution ALMA data of central emission in non-blazar RL AGNs also show either no mm polarization or one comparable with the upper limits for our RQ sample (Sect. 5.5).
-
Deep mm observations reveal faint structures at the ∼0.1−0.2 mJy/beam level (2–3σ, < 10% of the AGN emission) surrounding NGC 3783 and MCG 5–23–16, extending over at least a few tens of parsecs, which were not previously detected (Sect. 5.1). In NGC 3783, the extended mm emission is co-spatial with the narrow-line region observed earlier by MUSE (den Brok et al. 2020) and GRAVITY (GRAVITY Collaboration 2021).
-
While no polarization is detected from the AGN itself, NGC 3783 exhibits an unresolved polarized source with a PD ≈17%, located ∼20 pc from the AGN mm core (Sect. 5.1). Since the separation between the maxima of the total and polarized intensity exceeds the beam size, the polarized source is definitely not the AGN itself. Instead, it is co-spatial with the extended mm structure and the narrow-line outflow. This polarized emission may be linked to the processes in the AGN outflow, such as a propagating shock. The steep in-band spectral index, α = −3.6 ± 2.4, suggests an event with rapid electron cooling; however, the large uncertainty highlights the need for additional observations.
-
The studied sources show no mm flux variability during the observational sessions, suggesting that the mm source size exceeds ∼1 light hour. A compilation of archival ALMA Band 3 data for the RQ AGNs in our sample reveals mm flux variations in all sources by a typical factor of 2 (Sect. 5.3). However, due to the lack of regular mm monitoring and simultaneous observations in other bands, we cannot determine the mechanism driving this variability. Assuming energy equipartition, we estimated the minimum size of the emitting synchrotron sources to be ∼90–600 Rg, while archival radio data provided upper limits on the emitting region size of 103 − 104Rg (Sect. 5.4).
From these polarimetric ALMA observations, the key insight is not the detection of mm polarization itself, but rather its absence with a very low upper limit of 0.5%, providing a crucial clue to the origin of the compact mm emission. Among various synchrotron-emitting AGN structures, only the X-ray corona, because of its electron density, exhibits sufficient Faraday depolarization to fully suppress the observed polarization. However, to strengthen this argument, highly sensitive mm polarimetric observations with higher spectral resolution, on the order of tens of MHz, are necessary to avoid bandwidth depolarization caused by the large RMs discussed in Sect. 2. Additionally, extending observations to higher frequencies, up to ∼500 GHz, would help us probe deeper into the emitting region.
In the optically thick regime, the polarization angle is rotated by 90° relative to the optically thin case, and polarization remains wavelength-independent, with the intrinsic PD given by  , yielding values around 10–12% for γ = 2 − 3 (Pacholczyk 1977).
In certain AGN outflows, densities can reach 104–105 cm−3 or more. Such high-density outflows are usually associated with ultrafast outflows (e.g., Xu et al. 2024) and ultraluminous infrared galaxies or compact radio sources (e.g., Holt et al. 2011; Santoro et al. 2018), none of which apply to the sources in our sample.
The typical strength of the large-scale magnetic field in galaxies is up to a few dozen microgauss. Here, we assume an upper limit of B of a few milligauss, as observed in magnetized clouds of the Milky Way (see Beck & Wielebinski 2013, for a review).
Throughout this section, in-band spectral indices are derived from ALMA archival images in individual spectral windows, assuming flux uncertainties as specified in the ALMA Proposer’s Guide.
Acknowledgments
This paper makes use of the following ALMA data: ADS/JAO.ALMA#2023.1.01517.S. ALMA is a partnership of ESO (representing its member states), NSF (USA) and NINS (Japan), together with NRC (Canada), NSTC and ASIAA (Taiwan), and KASI (Republic of Korea), in cooperation with the Republic of Chile. The Joint ALMA Observatory is operated by ESO, AUI/NRAO, and NAOJ. We sincerely thank Ari Laor for the valuable comments and feedback. ES acknowledges a Humboldt Research Fellowship by the Alexander von Humboldt Foundation, ANID BASAL project FB210003, and Gemini ANID ASTRO21-0003. CR acknowledges support from Fondecyt Regular grant 1230345, ANID BASAL project FB210003, and the China-Chile joint research fund. TK is supported by JSPS KAKENHI grant numbers 23K13153/24K00673.
References
- Beck, R., & Wielebinski, R. 2013, in Planets, Stars and Stellar Systems. Volume 5: Galactic Structure and Stellar Populations, eds. T. D. Oswalt, & G. Gilmore, 5, 641 [NASA ADS] [Google Scholar]
- Behar, E., Baldi, R. D., Laor, A., et al. 2015, MNRAS, 451, 517 [NASA ADS] [CrossRef] [Google Scholar]
- Behar, E., Kaspi, S., Paubert, G., et al. 2020, MNRAS, 491, 3523 [NASA ADS] [CrossRef] [Google Scholar]
- Bendo, G. J., Henkel, C., D’Cruze, M. J., et al. 2016, MNRAS, 463, 252 [NASA ADS] [CrossRef] [Google Scholar]
- Bentz, M. C., Street, R., Onken, C. A., & Valluri, M. 2021, ApJ, 906, 50 [Google Scholar]
- Burlon, D., Ghirlanda, G., Murphy, T., et al. 2013, MNRAS, 431, 2471 [Google Scholar]
- Burn, B. J. 1966, MNRAS, 133, 67 [Google Scholar]
- Chen, S., Laor, A., Behar, E., et al. 2025, ApJ, 979, 241 [Google Scholar]
- Condon, J. J., & Ransom, S. M. 2016, Essential Radio Astronomy (Princeton, NJ: Princeton University Press) [Google Scholar]
- Condon, J. J., Cotton, W. D., Greisen, E. W., et al. 1998, AJ, 115, 1693 [Google Scholar]
- Davies, R., Baron, D., Shimizu, T., et al. 2020, MNRAS, 498, 4150 [Google Scholar]
- den Brok, M., Carollo, C. M., Erroz-Ferrer, S., et al. 2020, MNRAS, 491, 4089 [NASA ADS] [Google Scholar]
- Elmouttie, M., Haynes, R. F., Jones, K. L., et al. 1997, MNRAS, 284, 830 [NASA ADS] [CrossRef] [Google Scholar]
- Emig, K. L., Bolatto, A. D., Leroy, A. K., et al. 2020, ApJ, 903, 50 [NASA ADS] [CrossRef] [Google Scholar]
- Event Horizon Telescope Collaboration (Akiyama, K., et al.) 2021, ApJ, 910, L12 [Google Scholar]
- Fischer, T. C., Crenshaw, D. M., Kraemer, S. B., & Schmitt, H. R. 2013, ApJS, 209, 1 [Google Scholar]
- Gaia Collaboration (Vallenari, A., et al.) 2023, A&A, 674, A1 [NASA ADS] [CrossRef] [EDP Sciences] [Google Scholar]
- Gardner, F. F., & Whiteoak, J. B. 1966, ARA&A, 4, 245 [NASA ADS] [CrossRef] [Google Scholar]
- Gianolli, V. E., Kim, D. E., Bianchi, S., et al. 2023, MNRAS, 523, 4468 [NASA ADS] [CrossRef] [Google Scholar]
- Goddi, C., Martí-Vidal, I., Messias, H., et al. 2021, ApJ, 910, L14 [NASA ADS] [CrossRef] [Google Scholar]
- Goddi, C., Carlos, D. F., Crew, G. B., et al. 2025, A&A, 699, A265 [NASA ADS] [CrossRef] [EDP Sciences] [Google Scholar]
- GRAVITY Collaboration (Amorim, A., et al.) 2021, A&A, 648, A117 [NASA ADS] [CrossRef] [EDP Sciences] [Google Scholar]
- Guedel, M., & Benz, A. O. 1993, ApJ, 405, L63 [NASA ADS] [CrossRef] [Google Scholar]
- Haardt, F., & Maraschi, L. 1993, ApJ, 413, 507 [Google Scholar]
- Healey, S. E., Romani, R. W., Taylor, G. B., et al. 2007, ApJS, 171, 61 [Google Scholar]
- Henkel, C., Mühle, S., Bendo, G., et al. 2018, A&A, 615, A155 [NASA ADS] [CrossRef] [EDP Sciences] [Google Scholar]
- Hickox, R. C., & Alexander, D. M. 2018, ARA&A, 56, 625 [Google Scholar]
- Holt, J., Tadhunter, C. N., Morganti, R., & Emonts, B. H. C. 2011, MNRAS, 410, 1527 [NASA ADS] [Google Scholar]
- Hovatta, T., O’Sullivan, S., Martí-Vidal, I., Savolainen, T., & Tchekhovskoy, A. 2019, A&A, 623, A111 [NASA ADS] [CrossRef] [EDP Sciences] [Google Scholar]
- Hunter, T. R., Indebetouw, R., Brogan, C. L., et al. 2023, PASP, 135, 074501 [NASA ADS] [CrossRef] [Google Scholar]
- Inoue, Y., & Doi, A. 2014, PASJ, 66, L8 [NASA ADS] [CrossRef] [Google Scholar]
- Inoue, Y., & Doi, A. 2018, ApJ, 869, 114 [Google Scholar]
- Inoue, Y., Totani, T., & Ueda, Y. 2008, ApJ, 672, L5 [Google Scholar]
- Ivezić, Ž., Menou, K., Knapp, G. R., et al. 2002, AJ, 124, 2364 [CrossRef] [Google Scholar]
- Kardashev, N. S., Khartov, V. V., Abramov, V. V., et al. 2013, Astron. Rep., 57, 153 [Google Scholar]
- Kawamuro, T., Ricci, C., Imanishi, M., et al. 2022, ApJ, 938, 87 [NASA ADS] [CrossRef] [Google Scholar]
- Kawamuro, T., Ricci, C., Mushotzky, R. F., et al. 2023, ApJS, 269, 24 [NASA ADS] [CrossRef] [Google Scholar]
- Kellermann, K. I., Sramek, R., Schmidt, M., Shaffer, D. B., & Green, R. 1989, AJ, 98, 1195 [Google Scholar]
- Koss, M. J., Ricci, C., Trakhtenbrot, B., et al. 2022, ApJS, 261, 2 [NASA ADS] [CrossRef] [Google Scholar]
- Laor, A., & Behar, E. 2008, MNRAS, 390, 847 [NASA ADS] [CrossRef] [Google Scholar]
- Le Roux, E. 1961, Ann. Astrophys., 24, 71 [Google Scholar]
- Lenc, E., & Tingay, S. J. 2009, AJ, 137, 537 [Google Scholar]
- Lopez-Rodriguez, E., Alonso-Herrero, A., García-Burillo, S., et al. 2020, ApJ, 893, 33 [NASA ADS] [CrossRef] [Google Scholar]
- Lopez-Rodriguez, E., Kishimoto, M., Antonucci, R., et al. 2023, ApJ, 951, 31 [NASA ADS] [CrossRef] [Google Scholar]
- Lyutikov, M. 2003, New Astron. Rev., 47, 513 [Google Scholar]
- Magno, M., Smith, K. L., Wong, O. I., et al. 2025, ApJ, 981, 202 [Google Scholar]
- Marinucci, A., Porquet, D., Tamborra, F., et al. 2019, A&A, 623, A12 [NASA ADS] [CrossRef] [EDP Sciences] [Google Scholar]
- Marscher, A. P. 2014, ApJ, 780, 87 [Google Scholar]
- Martí-Vidal, I., Vlemmings, W. H. T., & Muller, S. 2016, A&A, 593, A61 [NASA ADS] [CrossRef] [EDP Sciences] [Google Scholar]
- Mauch, T., Murphy, T., Buttery, H. J., et al. 2003, MNRAS, 342, 1117 [Google Scholar]
- McCarthy, T. P., Ellingsen, S. P., Breen, S. L., et al. 2018, MNRAS, 480, 4578 [Google Scholar]
- McConnell, D., Sadler, E. M., Murphy, T., & Ekers, R. D. 2012, MNRAS, 422, 1527 [NASA ADS] [CrossRef] [Google Scholar]
- Merloni, A., & Fabian, A. C. 2001, MNRAS, 321, 549 [NASA ADS] [CrossRef] [Google Scholar]
- Michiyama, T., Inoue, Y., Doi, A., et al. 2024, ApJ, 965, 68 [NASA ADS] [CrossRef] [Google Scholar]
- Miller, J. A. 1996, Particle Acceleration in Active Galactic Nuclei, Technical Report, NASA/CR-96-208012; NAS 1.26:208012 Dept. of Physics [Google Scholar]
- Montier, L., Plaszczynski, S., Levrier, F., et al. 2015a, A&A, 574, A135 [NASA ADS] [CrossRef] [EDP Sciences] [Google Scholar]
- Montier, L., Plaszczynski, S., Levrier, F., et al. 2015b, A&A, 574, A136 [NASA ADS] [CrossRef] [EDP Sciences] [Google Scholar]
- Morganti, R., Tsvetanov, Z. I., Gallimore, J., & Allen, M. G. 1999, A&AS, 137, 457 [NASA ADS] [CrossRef] [EDP Sciences] [Google Scholar]
- Nagai, H., Nakanishi, K., Paladino, R., et al. 2016, ApJ, 824, 132 [NASA ADS] [CrossRef] [Google Scholar]
- Orienti, M., & Prieto, M. A. 2010, MNRAS, 401, 2599 [NASA ADS] [CrossRef] [Google Scholar]
- O’Sullivan, S. P., & Gabuzda, D. C. 2009, MNRAS, 400, 26 [Google Scholar]
- Pacholczyk, A. G. 1977, Oxford Pergamon Press International Series on Natural Philosophy, 89 [Google Scholar]
- Panessa, F., Tarchi, A., Castangia, P., et al. 2015, MNRAS, 447, 1289 [NASA ADS] [CrossRef] [Google Scholar]
- Panessa, F., Baldi, R. D., Laor, A., et al. 2019, Nat. Astron., 3, 387 [Google Scholar]
- Peng, S., Lu, R.-S., Goddi, C., et al. 2024, ApJ, 975, 103 [Google Scholar]
- Petrucci, P. O., Piétu, V., Behar, E., et al. 2023, A&A, 678, L4 [NASA ADS] [CrossRef] [EDP Sciences] [Google Scholar]
- Raginski, I., & Laor, A. 2016, MNRAS, 459, 2082 [CrossRef] [Google Scholar]
- Ricci, C., Trakhtenbrot, B., Koss, M. J., et al. 2017, ApJS, 233, 17 [Google Scholar]
- Ricci, C., Ho, L. C., Fabian, A. C., et al. 2018, MNRAS, 480, 1819 [NASA ADS] [CrossRef] [Google Scholar]
- Ricci, C., Chang, C.-S., Kawamuro, T., et al. 2023, ApJ, 952, L28 [NASA ADS] [CrossRef] [Google Scholar]
- Roy, A. L., Oosterloo, T., Goss, W. M., & Anantharamaiah, K. R. 2010, A&A, 517, A82 [NASA ADS] [CrossRef] [EDP Sciences] [Google Scholar]
- Rybak, M., Sluse, D., Gupta, K. K., et al. 2025, A&A, 701, A215 [NASA ADS] [CrossRef] [EDP Sciences] [Google Scholar]
- Rybicki, G. B., & Lightman, A. P. 1979, Radiative Processes in Astrophysics (New York: Wiley) [Google Scholar]
- Santoro, F., Rose, M., Morganti, R., et al. 2018, A&A, 617, A139 [NASA ADS] [CrossRef] [EDP Sciences] [Google Scholar]
- Schmitt, H. R., Ulvestad, J. S., Antonucci, R. R. J., & Kinney, A. L. 2001, ApJS, 132, 199 [NASA ADS] [CrossRef] [Google Scholar]
- Serafinelli, R., Marinucci, A., De Rosa, A., et al. 2023, MNRAS, 526, 3540 [NASA ADS] [CrossRef] [Google Scholar]
- Shablovinskaia, E., Ricci, C., Chang, C.-S., et al. 2025, A&A, in press, https://doi.org/10.1051/0004-6361/202554285 [Google Scholar]
- Shablovinskaya, E., Ricci, C., Chang, C. S., et al. 2024, A&A, 690, A232 [NASA ADS] [CrossRef] [EDP Sciences] [Google Scholar]
- Sokoloff, D. D., Bykov, A. A., Shukurov, A., et al. 1998, MNRAS, 299, 189 [Google Scholar]
- Ulvestad, J. S., & Wilson, A. S. 1984, ApJ, 285, 439 [Google Scholar]
- Unger, S. W., Lawrence, A., Wilson, A. S., Elvis, M., & Wright, A. E. 1987, MNRAS, 228, 521 [NASA ADS] [Google Scholar]
- Xu, Y., Pinto, C., Kara, E., et al. 2024, A&A, 692, A78 [NASA ADS] [CrossRef] [EDP Sciences] [Google Scholar]
- Yamada, T., Sakai, N., Inoue, Y., & Michiyama, T. 2024, ApJ, 968, 116 [Google Scholar]
- Yushkov, E., Pashchenko, I. N., Sokoloff, D., & Chumarin, G. 2024, MNRAS, 535, 1888 [Google Scholar]
Appendix
ALMA data
The tables provided contain the data used in Fig. 5. α is the in-band spectral index, and θ is the angular resolution in arcsec.
Archival ALMA Band 3 data for NGC 3783.
Archival ALMA Band 3 data for MCG 5–23–16.
Archival ALMA Band 3 data for NGC 4945.
Appendix
Radio data
The tables provided contain the data used in Fig. 6. θ is the angular resolution in arcsec. For NGC 4945, note that, regardless of resolution, the flux was integrated over the entire central emitting region of the galaxy.
Archival radio data for NGC 3783.
Archival radio data for MCG 5–23–16.
Archival radio data for NGC 4945.
All Tables
All Figures
|
Fig. 1. ALMA observations of NGC 3783. Upper panel: Total intensity with the contours corresponding to the 2, 4, 6, 18, and 50σ levels (1σ = 0.007 mJy/beam) in the box ∼0.9 × 0.9″. The location of the AGNs according to Gaia DR3 (Gaia Collaboration 2023) is marked with a black cross. Middle panel: Polarized intensity with the overplotted total intensity contours. Bottom panel: Polarization degree in percent. The areas with a signal-to-noise ratio of < 5 on the total intensity map are masked. |
| In the text | |
|
Fig. 2. ALMA observations of MCG 5–23–16. Upper panel: Total intensity with the contours corresponding to the 4, 6, 19, and 37σ levels (1σ = 0.010 mJy/beam) in the box ∼1 × 1″. The location of the AGNs according to Gaia DR3 (Gaia Collaboration 2023) is marked with a black cross. Middle panel: Polarized intensity with the overplotted total intensity contours. Bottom panel: Polarization degree in percent. The areas with a signal-to-noise ratio of < 5 on the total intensity map are masked. |
| In the text | |
|
Fig. 3. ALMA observations of NGC 4945. Upper panel: Total intensity with the contours corresponding to the 31, 46, 55, 92, and 184σ levels (1σ = 0.016 mJy/beam) in the box ∼1.2 × 1.2″. The location of the AGNs, where mm emission peaks, is marked with a black cross. Middle panel: Polarized intensity with the overplotted total intensity contours. Bottom panel: Polarization degree in percent. The areas with a signal-to-noise ratio of < 5 on the total intensity map are masked. |
| In the text | |
|
Fig. 4. Map of the in-band spectral index α (upper panel) and its associated error (bottom panel) of NGC 3783. Dashed contours represent the total intensity (see Fig. 1). The position of the polarized source is highlighted by a thick black contour. Note that the very steep slope in the outer regions is likely an artifact caused by the slightly narrower beam size at higher frequencies. |
| In the text | |
|
Fig. 5. Archival ALMA Band 3 data. Only observations with a resolution higher than 0 |
| In the text | |
|
Fig. 6. Compilation of archival radio and ALMA data (see details in Tables B.1, B.2, and B.3): NGC 3783 (a), MCG 5–23–16 (b), and NGC 4945 (c). The radio data below 100 GHz is fit with a power law. |
| In the text | |
Current usage metrics show cumulative count of Article Views (full-text article views including HTML views, PDF and ePub downloads, according to the available data) and Abstracts Views on Vision4Press platform.
Data correspond to usage on the plateform after 2015. The current usage metrics is available 48-96 hours after online publication and is updated daily on week days.
Initial download of the metrics may take a while.