Fig. 3
Download original image
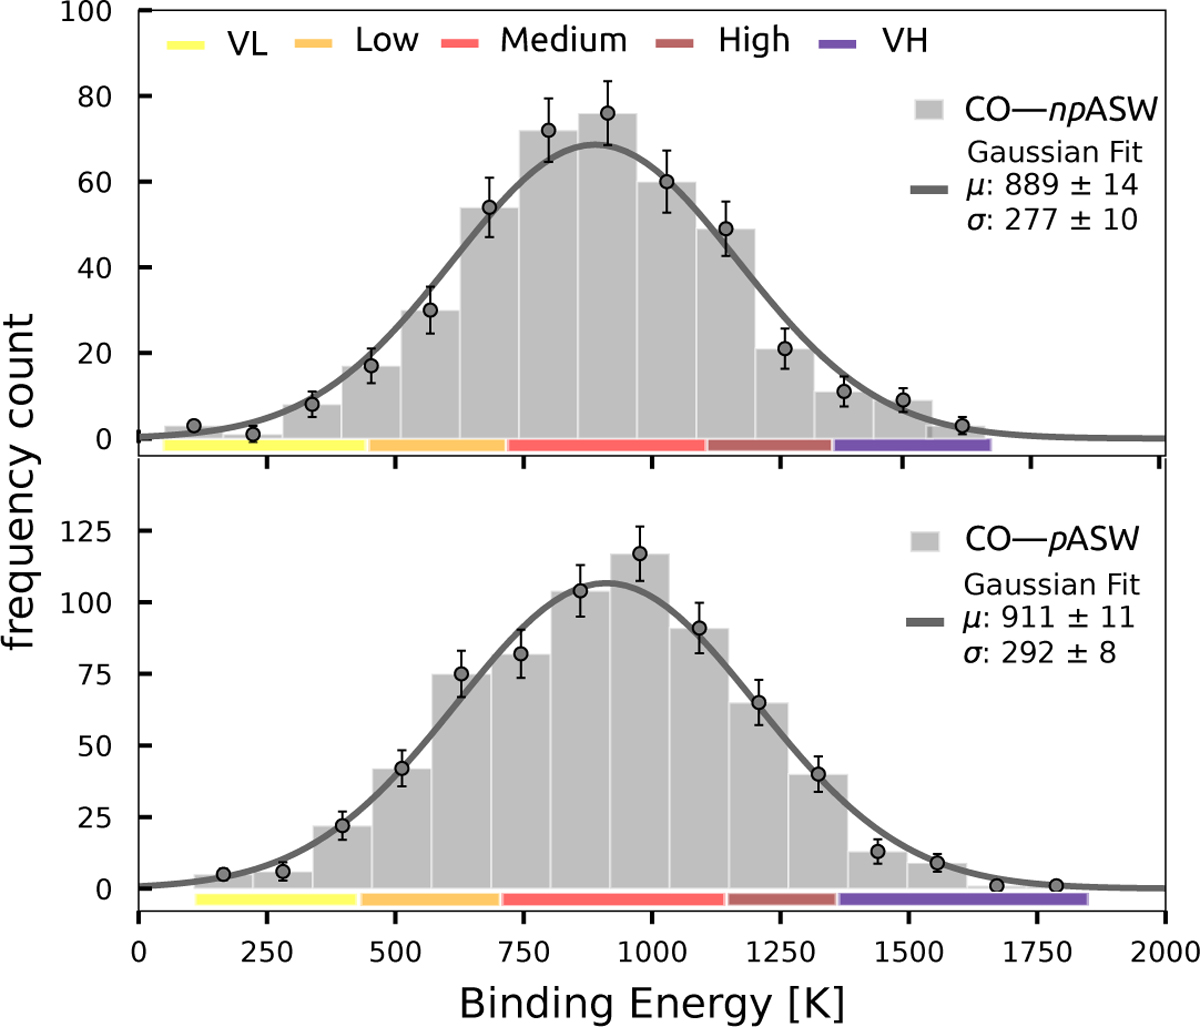
Histograms of the ZPVE corrected BEs obtained for CO adsorbed on five npASW (upper panel) and five pASW surfaces (lower panel). The color-coded bars below each panel indicate the BE groups (VL: Very Low, Low, Medium, High, and VH: Very High). Gaussian fits were obtained using the bootstrap procedure detailed in Appendix E, which propagates individual uncertainties from the neural-network models into the Gaussian fitting procedure.
Current usage metrics show cumulative count of Article Views (full-text article views including HTML views, PDF and ePub downloads, according to the available data) and Abstracts Views on Vision4Press platform.
Data correspond to usage on the plateform after 2015. The current usage metrics is available 48-96 hours after online publication and is updated daily on week days.
Initial download of the metrics may take a while.