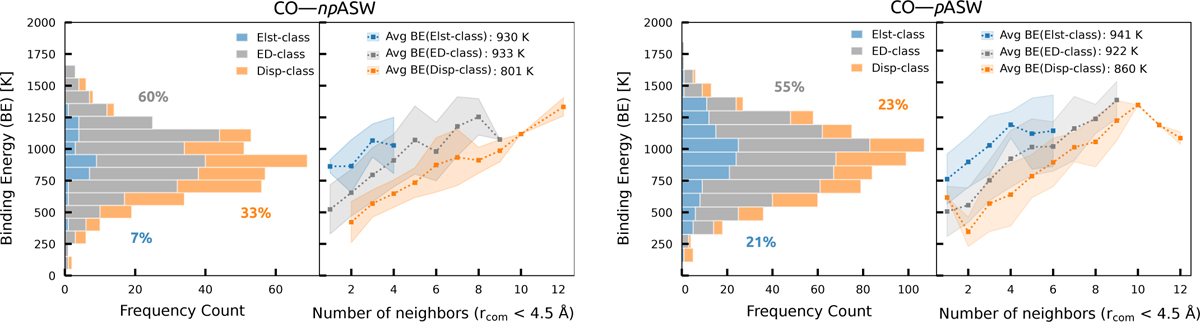
Fig. 4
Download original image
CO-npASW panel showing (left) BE distribution for CO on npASW ice, with color mapping highlighting the dominant interaction contributions at various binding sites, ranging from primarily electrostatic (Elst-class, blue) to purely dispersion (Disp-class, orange), while ED-class (gray) represents an intermediate group. The coefficient that determines the class of a binding site is the ratio between the dispersion energy and the sum of the attractive interaction energies (electrostatic, induction, and dispersion), as defined in Sect. 2.2. (Right) Correlation between the BE and CO number of neighbors (i.e., the number of water molecules within a radius of 4.5 Å of the CO center of mass) for each class of binding sites. Averages are shown as points connected by a dashed line, and the standard deviation is shown as a shaded region of matching color. CO-pASW panel: Analogous data for pASW ice.
Current usage metrics show cumulative count of Article Views (full-text article views including HTML views, PDF and ePub downloads, according to the available data) and Abstracts Views on Vision4Press platform.
Data correspond to usage on the plateform after 2015. The current usage metrics is available 48-96 hours after online publication and is updated daily on week days.
Initial download of the metrics may take a while.