Fig. 6
Download original image
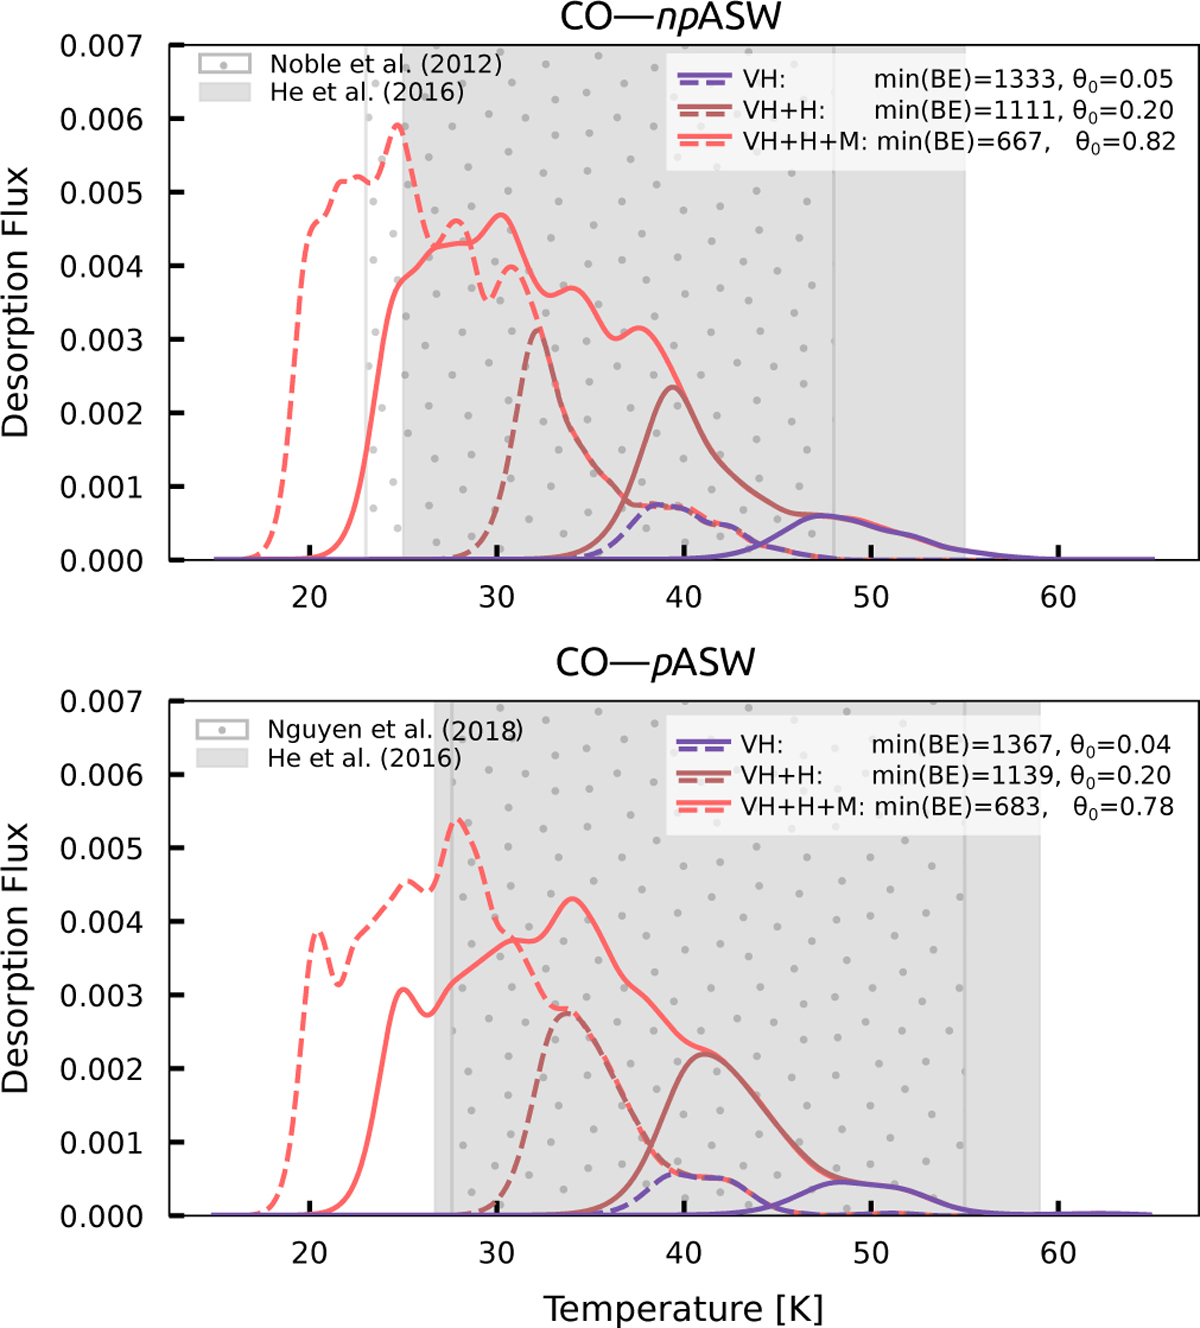
Simulated TPD traces using BE distributions from our study compared to different experimental results of multicoverage TPD desorption from Noble et al. (2012b), Nguyen et al. (2018), and He et al. (2016). The heating ramp rate (β) is 0.3 K s−1 (See Appendix G for further details). Different colored TPD traces correspond to simulations considering different BE cutoffs in the distribution, excluding BEs lower than min(BE)(see Table 3). The initial coverage for each TPD trace corresponds to the fraction of molecules of the full distribution remaining after applying the cutoff. The shaded area represents the range of experimental TPD results. Two pre-exponential factors are shown: v = 1012 s−1 (solid lines) and v = 9.14 × 10¹⁴ s−1 (dashed lines), the latter is derived from transition state theory as detailed in Minissale et al. (2022).
Current usage metrics show cumulative count of Article Views (full-text article views including HTML views, PDF and ePub downloads, according to the available data) and Abstracts Views on Vision4Press platform.
Data correspond to usage on the plateform after 2015. The current usage metrics is available 48-96 hours after online publication and is updated daily on week days.
Initial download of the metrics may take a while.