Fig. 7
Download original image
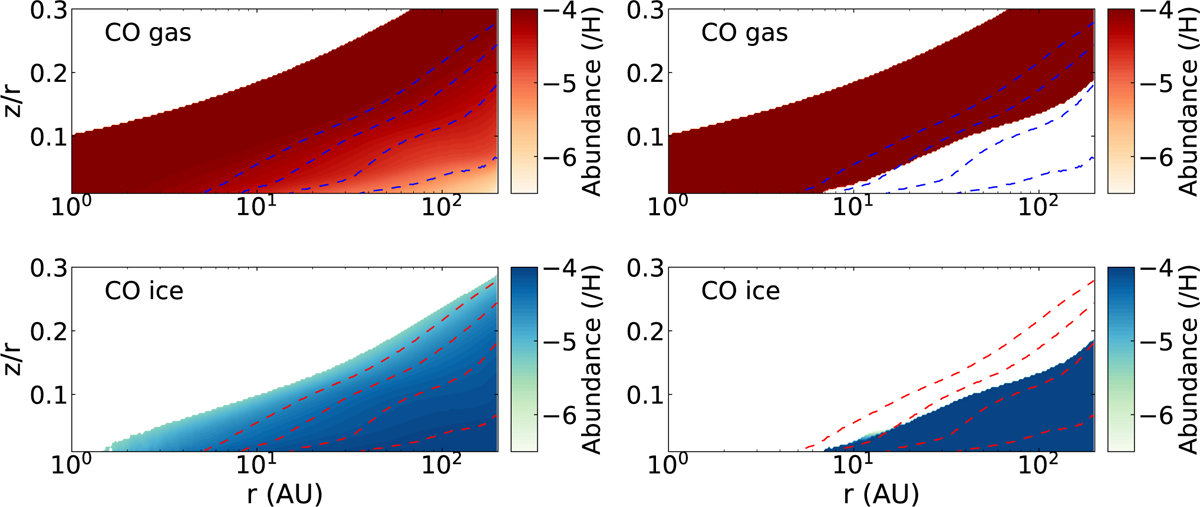
Two dimensional spatial distributions of CO gas (upper panels) and ice (lower panels) abundances on the disk, shown using a multibinding description (left panels) and a single binding description (right panels). The vertical axes represent height normalized by radius. Dashed lines depict the positions where the dust temperature is equal to 30, 25, 15, and 10 K.
Current usage metrics show cumulative count of Article Views (full-text article views including HTML views, PDF and ePub downloads, according to the available data) and Abstracts Views on Vision4Press platform.
Data correspond to usage on the plateform after 2015. The current usage metrics is available 48-96 hours after online publication and is updated daily on week days.
Initial download of the metrics may take a while.