Fig. C.1
Download original image
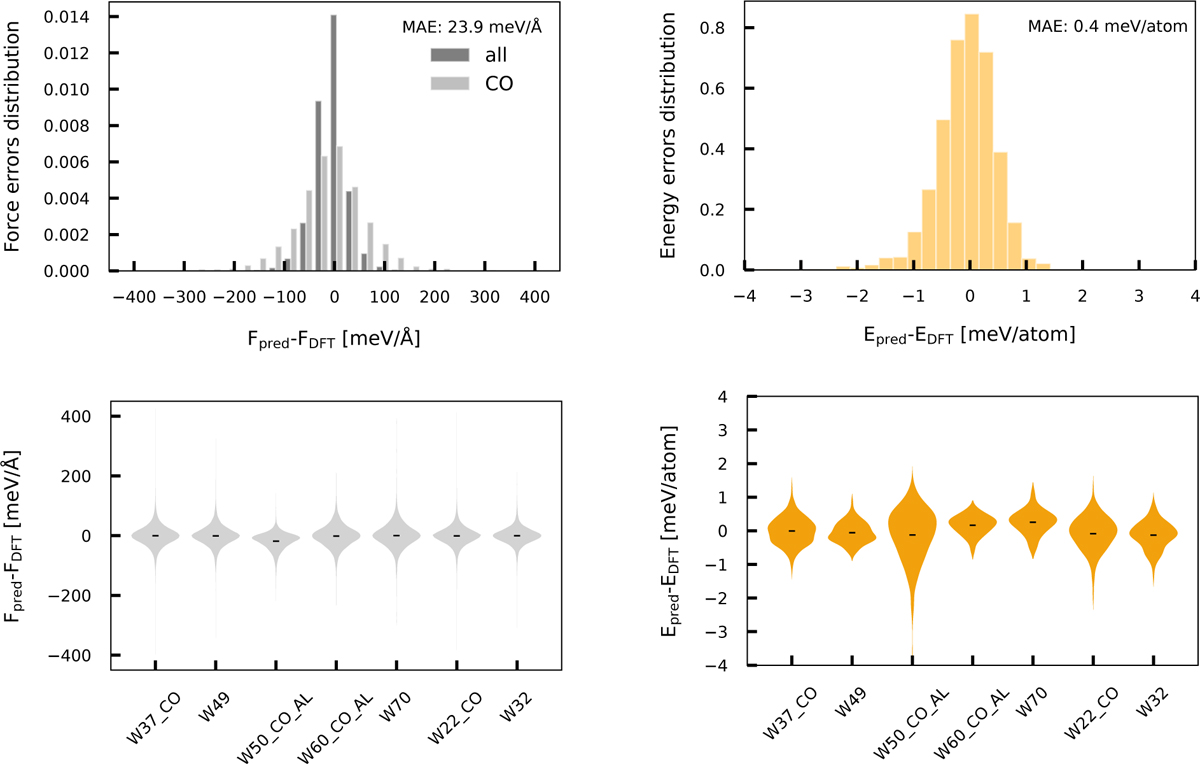
Force and energy prediction errors for the test set (16% of the dataset) are summarized across different molecular systems. The upper plots highlight overall errors, while in the lower section, violin plots show the distribution of errors in both forces (left) and energies (right), grouped by chemical formula. Mean errors for each system are marked to aid comparison.
Current usage metrics show cumulative count of Article Views (full-text article views including HTML views, PDF and ePub downloads, according to the available data) and Abstracts Views on Vision4Press platform.
Data correspond to usage on the plateform after 2015. The current usage metrics is available 48-96 hours after online publication and is updated daily on week days.
Initial download of the metrics may take a while.