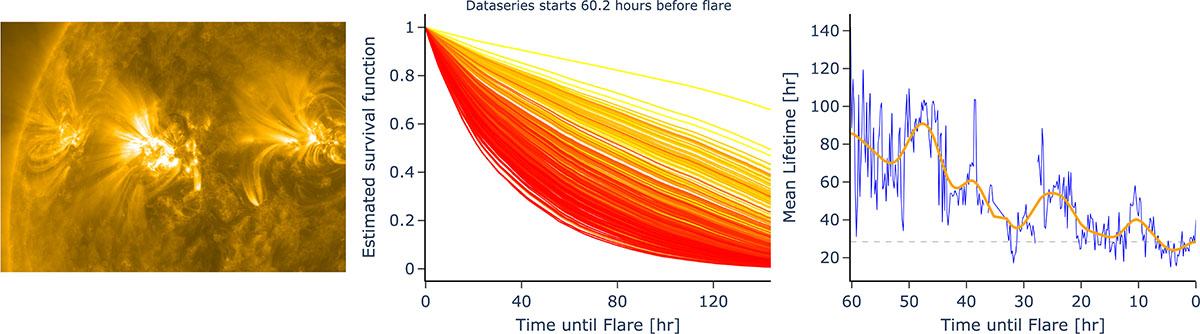
Fig. A.1.
Download original image
Left: Image of active region AR11261 in AIA channel 171, close before the occurrence of a M9.3 flare on 30 July 2011 (SOL2011-07-30T02:04). Other active regions (AR11263 & AR11260) are close by, potentially increasing the ambiguity of the model. Middle: Estimated survival curves as the time series approaches the event (yellow to red). A trend is visible. Right: Lifetime showing a decreasing trend starting around 48 hours before the flare. However, at the time of the event, the mean lifetime is still as high as 30 hours.
Current usage metrics show cumulative count of Article Views (full-text article views including HTML views, PDF and ePub downloads, according to the available data) and Abstracts Views on Vision4Press platform.
Data correspond to usage on the plateform after 2015. The current usage metrics is available 48-96 hours after online publication and is updated daily on week days.
Initial download of the metrics may take a while.