Fig. A.2.
Download original image
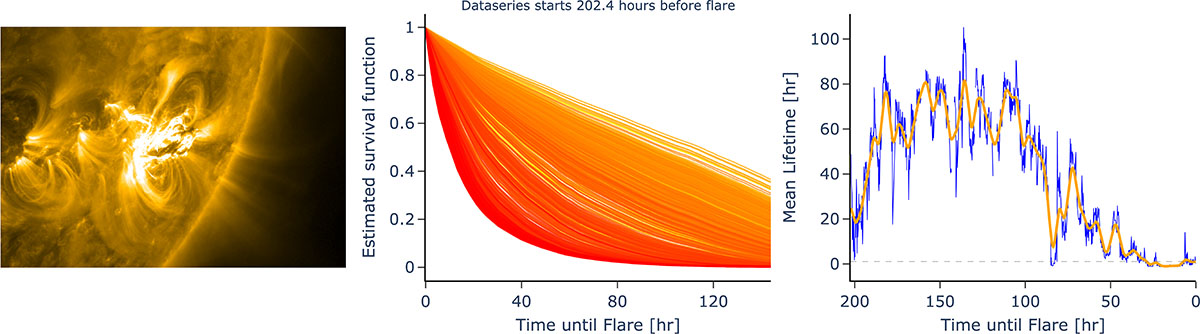
Left: Image of active region AR11226 in AIA channel 171, close before the occurrence of a M2.5 flare and coronal mass ejection on 7 June 2011 (SOL2011-06-07T06:16). Middle: Estimated survival curves as the time series approaches the event (yellow to red). Due to the high activity and varying lifetimes, the survival curves overlap and are difficult to interpret. Nonetheless, a trend is visible. Right: Mean lifetime curve extracted from the collection of survival curves as we approach the event. This is another example of the survival model accidentally capturing a C8.7 flare (SOL2011-05-29T20:11) at the beginning of the series, similar to the example captured in Fig. 6. The lifetime shows a decreasing trend roughly 5 days before the flare. C1.0 and C1.2 flares, with the addition of 3 B-flares, happened within 48 hours before the main event.
Current usage metrics show cumulative count of Article Views (full-text article views including HTML views, PDF and ePub downloads, according to the available data) and Abstracts Views on Vision4Press platform.
Data correspond to usage on the plateform after 2015. The current usage metrics is available 48-96 hours after online publication and is updated daily on week days.
Initial download of the metrics may take a while.