Fig. A.4.
Download original image
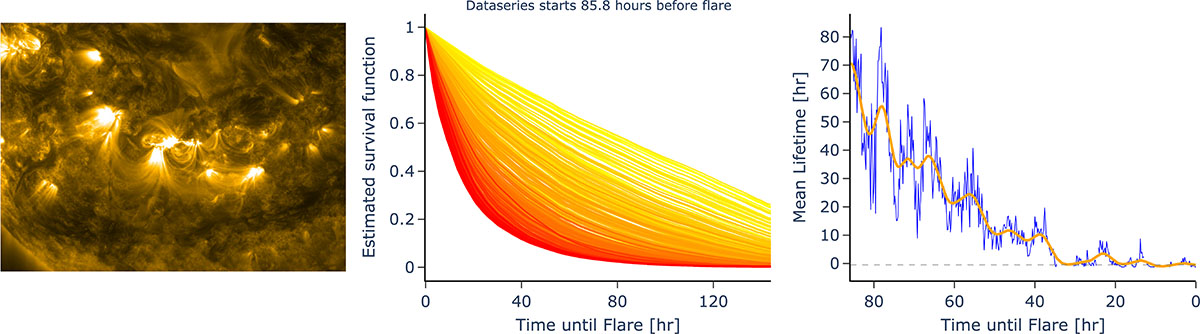
Left: Image of active region with SHARP-number 30482 in AIA channel 171, close before the occurrence of an M1.5 flare on 12 August 2013 (SOL2013-08-12T10:21). Middle: Evolution of the survival curves showing some minor fluctuations, but the overall trend is clearly visible. Right: Mean lifetimes make the fluctuations in the survival curve evolution clearer. However, Gaussian smoothing is able to remove these variations and extract a clear trend. Regular flares of C-type intensity occur starting ∼30 hours before the M1.5 flare, explaining the early convergence of the mean lifetime toward zero.
Current usage metrics show cumulative count of Article Views (full-text article views including HTML views, PDF and ePub downloads, according to the available data) and Abstracts Views on Vision4Press platform.
Data correspond to usage on the plateform after 2015. The current usage metrics is available 48-96 hours after online publication and is updated daily on week days.
Initial download of the metrics may take a while.