Fig. 6.
Download original image
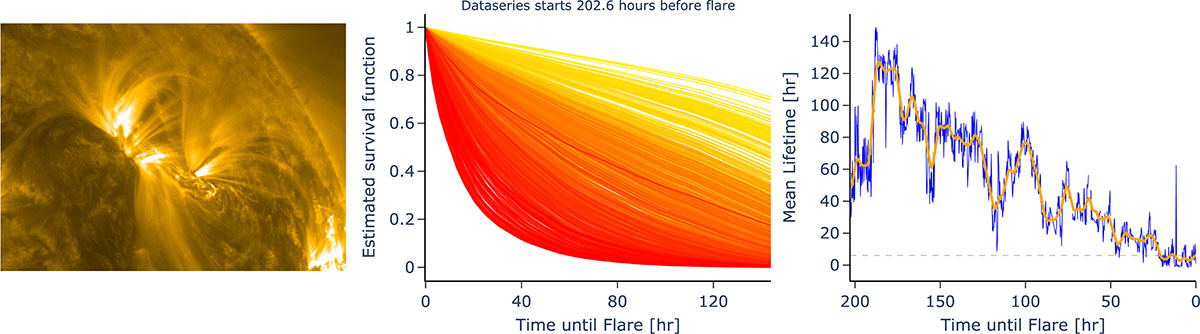
Left: Image of active region AR11169 in AIA channel 171, just before the occurrence of an M4.2 flare on 14 March 2011 (SOL2011-03-14T19:30). Middle: Estimated survival curves as the time series approaches the event (yellow to red). A clear trend is visible, showing the ability of the model to capture the evolving active region before a flare. Right: Mean lifetime curve extracted from the collection of survival curves as we approach the event. The orange curve represents a version of the blue mean lifetime prediction passed through a Gaussian smoothing kernel. The dip around 180 h corresponds to a C6.0 flare.
Current usage metrics show cumulative count of Article Views (full-text article views including HTML views, PDF and ePub downloads, according to the available data) and Abstracts Views on Vision4Press platform.
Data correspond to usage on the plateform after 2015. The current usage metrics is available 48-96 hours after online publication and is updated daily on week days.
Initial download of the metrics may take a while.