Fig. 7.
Download original image
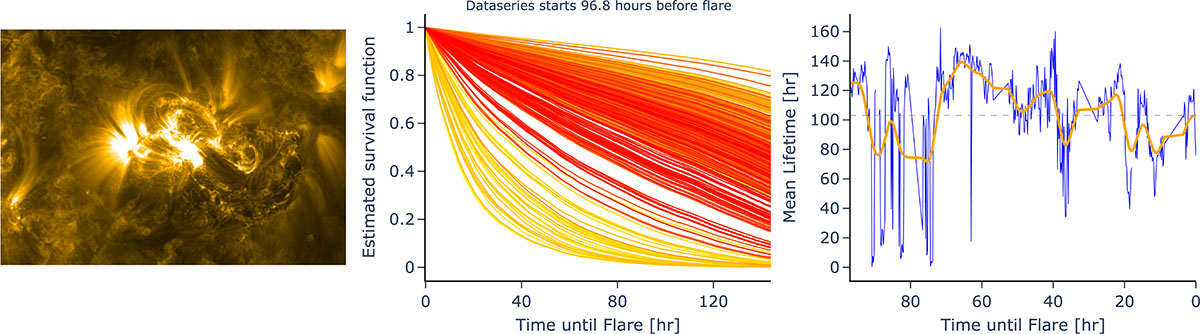
Left: Image of active region AR11432 in AIA channel 171, just before the occurrence of an M2.8 flare on 14 March 2012 (SOL2012-03-14T15:08). Middle: Estimated survival curves as the time series approaches the event (yellow to red). In contrast to the example displayed in Fig. 6, the model is visibly struggling to capture the timing of the flare. Right: Mean lifetimes extracted from the survival curves. There is no visible trend in the results, and outliers and fluctuations are more dominant. This is an example of the model failing.
Current usage metrics show cumulative count of Article Views (full-text article views including HTML views, PDF and ePub downloads, according to the available data) and Abstracts Views on Vision4Press platform.
Data correspond to usage on the plateform after 2015. The current usage metrics is available 48-96 hours after online publication and is updated daily on week days.
Initial download of the metrics may take a while.