Fig. 8.
Download original image
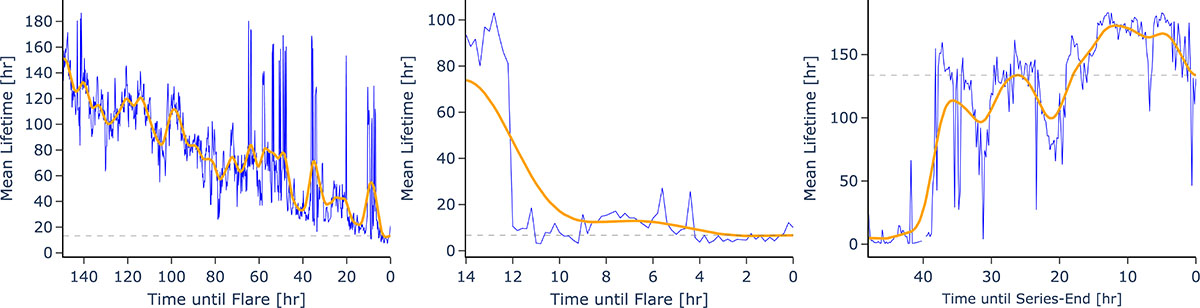
Predicted mean lifetime curves for active region AR12017. Left: Mean lifetime curve for an M2.0 flare on 28 March 2014 (SOL2014-03-28T19:04), the first major flare of the active region. The approach of the flare is clearly visible in the trend of the prediction. Middle: Prediction curve for an X1.0 following the M2.0 flare on the next day (SOL2014-03-29T17:48). The blue curve shows the rapid decrease in lifetime after a few hours, making the timing of the flare difficult to infer. Right: Final part of the series starts on 30 March 2014, where no further major flare occurred. After about 10 hours, the predicted mean lifetime increases, correctly indicating that no further flare will happen.
Current usage metrics show cumulative count of Article Views (full-text article views including HTML views, PDF and ePub downloads, according to the available data) and Abstracts Views on Vision4Press platform.
Data correspond to usage on the plateform after 2015. The current usage metrics is available 48-96 hours after online publication and is updated daily on week days.
Initial download of the metrics may take a while.