Fig. 1
Download original image
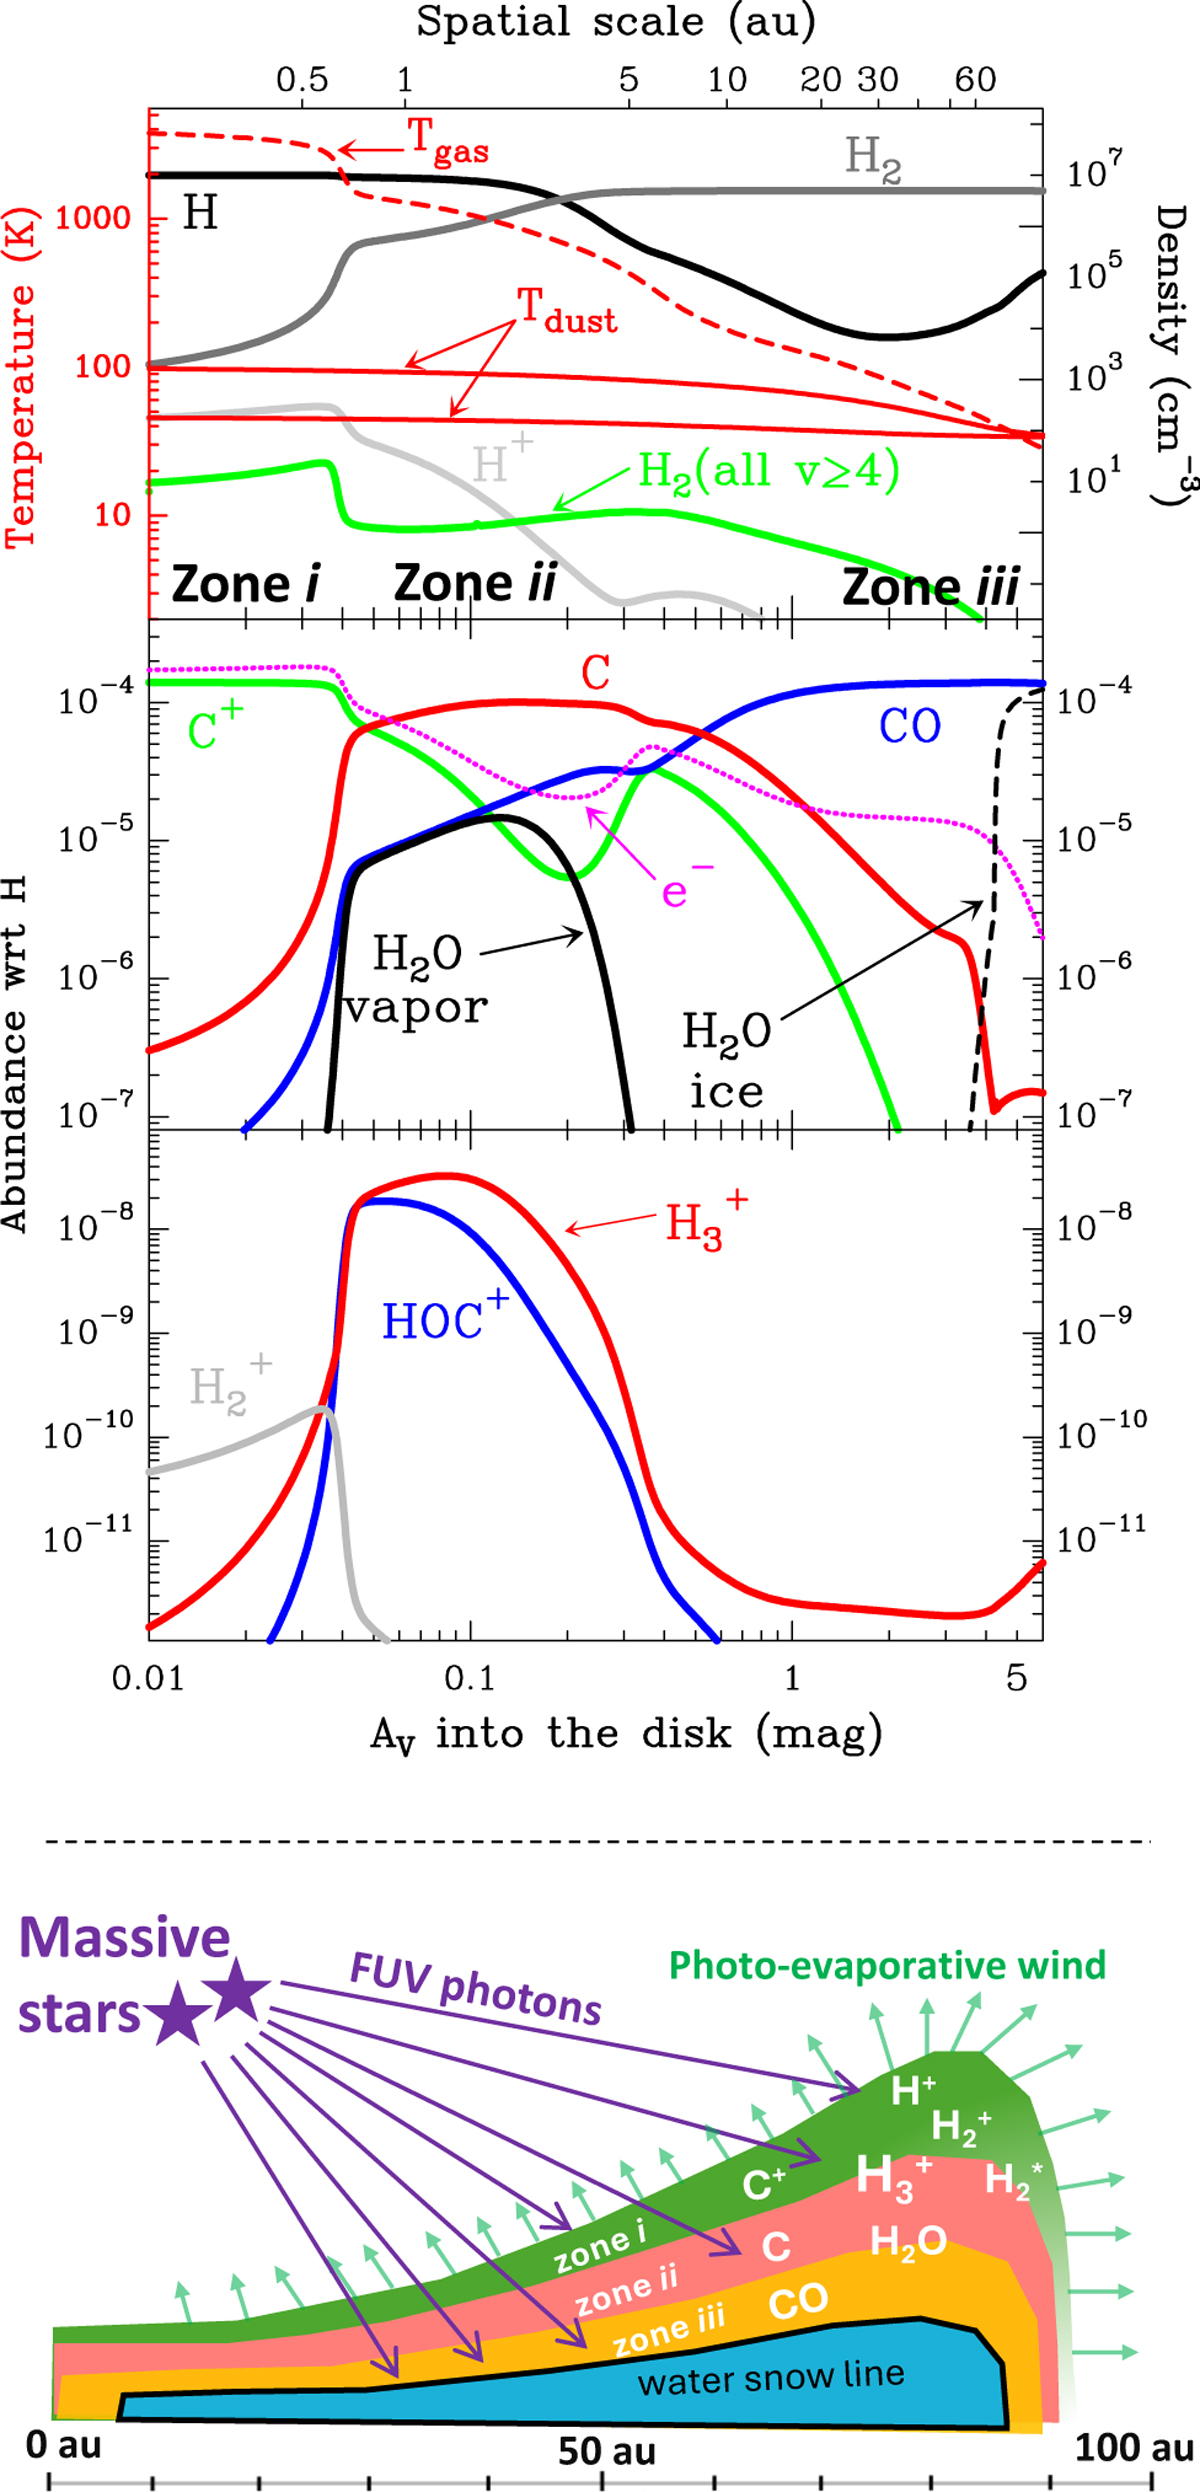
Physical (approximately vertical) structure of d203-506. Upper panel: model profiles of gas density, gas temperature, and a−3.5 grain-size distribution, showing the highest and lowest dust temperatures (corresponding to amin and amax grain radii, respectively) as a function of depth into the PDR. The green curve shows the density of ![]() . Lower panels: abundance profiles of selected species. Bottom sketch: simplified sketch illustrating the PDR component of an externally irradiated protoplanetary disk. The different colored regions correspond to the chemical zones discussed in Sect. 4.
. Lower panels: abundance profiles of selected species. Bottom sketch: simplified sketch illustrating the PDR component of an externally irradiated protoplanetary disk. The different colored regions correspond to the chemical zones discussed in Sect. 4.
Current usage metrics show cumulative count of Article Views (full-text article views including HTML views, PDF and ePub downloads, according to the available data) and Abstracts Views on Vision4Press platform.
Data correspond to usage on the plateform after 2015. The current usage metrics is available 48-96 hours after online publication and is updated daily on week days.
Initial download of the metrics may take a while.