| Issue |
A&A
Volume 703, November 2025
|
|
|---|---|---|
| Article Number | A189 | |
| Number of page(s) | 19 | |
| Section | Interstellar and circumstellar matter | |
| DOI | https://doi.org/10.1051/0004-6361/202555842 | |
| Published online | 18 November 2025 | |
- Top
- Abstract
- 1 Introduction
- 2 The irradiated disk d203-506 and its
 emission
 - 3 Representative model of the externally irradiated outer disk and photoevaporative wind
- 4
 chemistry in three different disk regions
 - 5 Discussion
- 6 Summary and conclusions
- Acknowledgements
- References
- Appendix A
- List of tables
- List of figures
 in irradiated protoplanetary disks: Linking far-ultraviolet radiation and water vapor
1
Instituto de Física Fundamental (CSIC).
Calle Serrano 121–123,
28006,
Madrid,
Spain
2
LUX, Observatoire de Paris, Université PSL, Sorbonne Université, CNRS,
92190
Meudon,
France
3
Chalmers University of Technology, Onsala Space Observatory,
Onsala,
Sweden
4
Institut de Recherche en Astrophysique et Planétologie, Université de Toulouse, CNRS, CNES,
Toulouse,
France
★ Corresponding author: This email address is being protected from spambots. You need JavaScript enabled to view it.
Received:
6
June
2025
Accepted:
20
September
2025
The likely JWST detection of vibrationally excited H3+ emission in Orion’s irradiated disk system d203-506 raises the important question of whether cosmic-ray ionization is enhanced in disks within clustered star-forming regions, or whether alternative mechanisms contribute to H3+ formation and excitation. We present a detailed model of the photodissociation region (PDR) component of a protoplanetary disk – comprising the outer disk surface and the photoevaporative wind – exposed to strong external far-ultraviolet (FUV) radiation. We investigate key gas-phase reactions involving excited H2 that lead to the formation of H3+ in the PDR, including detailed state-to-state dynamical calculations of reactions H2(v ≥ 0) + HOC+ → H3+ + CO and H2(v ≥ 0) + H+ → H2+ + H. We also consider the effects of photoionization of vibrationally excited H2(v ≥ 4), a process not previously included in PDR or disk models. We find that these FUV-driven reactions dominate the formation of H3+ in the PDR of strongly irradiated disks, largely independently of cosmic-ray ionization. The predicted H3+ abundance in the disk PDR peaks at x(H3+) ≳ 10−8, coinciding with regions of enhanced HOC+ and water vapor abundances, and is linked to the strength of the external FUV field (G0). The predicted H3+ column density (≲1013 cm−2) agrees with the presence of H3+ in the PDR of d203-506. We also find that formation pumping, resulting from exoergic reactions between excited H2 and HOC+, drives the vibrational excitation of H3+ in these regions. We expect this photochemistry to be highly active in disks where G0 > 103. The H3+ formation pathways studied here may also be relevant in the inner disk region (near the host star), in exoplanetary ionospheres, and in the early Universe.
Key words: astrochemistry / protoplanetary disks / ISM: molecules / photon-dominated region (PDR)
© The Authors 2025
 Open Access article, published by EDP Sciences, under the terms of the Creative Commons Attribution License (https://creativecommons.org/licenses/by/4.0), which permits unrestricted use, distribution, and reproduction in any medium, provided the original work is properly cited.
This article is published in open access under the Subscribe to Open model. This email address is being protected from spambots. You need JavaScript enabled to view it. to support open access publication.
1 Introduction
Most protoplanetary systems form in stellar clusters (Lada & Lada 2003) and are therefore eventually exposed to external ultraviolet (UV) radiation from nearby massive stars (e.g., Winter & Haworth 2022). UV irradiation can influence the disk’s chemical composition (Walsh et al. 2013; Boyden & Eisner 2020, 2023; Berné et al. 2023, 2024), impact gas line excitation (Zannese et al. 2024; Goicoechea et al. 2024), and alter the potential for planet formation. In particular, external UV radiation leads to disk mass loss driven by photoevaporative winds (Johnstone et al. 1998; Störzer & Hollenbach 1999), which truncate the outer disk, reduce the mass reservoir for planet formation, and impact the properties of gas giant planets forming within those disks (e.g., Winter et al. 2022; Qiao et al. 2023; Huang et al. 2024). However, the extent to which environmental UV radiation affects chemical processing and gas ionization remains controversial (e.g., Ramírez-Tannus et al. 2023; Díaz-Berríos et al. 2024; Schroetter et al. 2025a). This is a relevant question in the context of Solar System formation, as evidence suggests that the early solar nebula disk formed in a stellar cluster, not far from a massive star (Adams 2010; Bergin et al. 2024; Desch & Miret-Roig 2024).
Massive OB-type stars release intense UV radiation, reaching the disk population that gradually emerges from the natal cloud (e.g., van Terwisga & Hacar 2023). Extreme-UV (EUV; 13.6 < E < 100 eV) photons ionize the photoevaporative wind, creating the characteristic ionization front teardrop morphology around proplyds (e.g., O’dell et al. 1993; Bally et al. 2000; Maucó et al. 2023; Aru et al. 2024). External far-UV (FUV; 6 < E < 13.6 eV) photons penetrate deeper into the disk, heating the gas and dust and altering its chemical composition by ionizing atoms with low ionization potential (IP), triggering the formation of molecular ions and radicals (e.g., Berné et al. 2023, 2024; Zannese et al. 2024, 2025), and desorbing ice grain mantles (e.g., Walsh et al. 2013; Goicoechea et al. 2024). This FUV-irradiated disk zone, a “photodissociation region” (PDR, e.g., Hollenbach & Tielens 1999) exhibits high ionization fractions (xe = n(e−)/nH), a fundamental parameter in disk chemistry and dynamics, with xe of a few 10−4 at the PDR edge if  . Cosmic rays have a greater penetration depth. They are responsible for the much lower, but somewhat uncertain, ionization fraction in the FUV-shielded disk midplane, with
  down to ≈10−11, where ζ is the H2 ionization rate. Here, we assume that ζ is dominated by cosmic-ray ionizations, though it may also have local contributions from stellar X-rays and the decay of short-lived radionuclides (e.g., Cleeves et al. 2013, 2015).
Identifying tracers of FUV, xe, and ζ in various regions of a protoplanetary disk is critically important. Since its detection in the interstellar medium (ISM) of our galaxy (Geballe & Oka 1996) and beyond (Geballe et al. 2006), the IR “absorption” spectrum of  is considered one of the cleanest probes of ζ (e.g., McCall et al. 2002; Goto et al. 2008; Indriolo & McCall 2012). In ISM clouds, cosmic-ray ionization of H2 produces
  , which rapidly reacts with molecular hydrogen to form
  ,
,
 (1)
(1)
This is a highly exothermic reaction, ~1.7 eV (~20 000 K), nearly insensitive to the initial vibrational state of  for excitation energies below ~1 eV (del Mazo-Sevillano et al. 2024). Depending on xe, the destruction of
  can be dominated either by dissociative recombination with electrons or by exothermic proton transfer reactions with abundant species such as CO, N2, and O (e.g., Herbst & Klemperer 1973; Watson 1973; Black & Dalgarno 1977). The likely detection1 of infrared (IR)
  “emission” (see Schroetter et al. 2025b) in the irradiated disk d203-506, in the line of sight toward the Orion Bar, raises the question of whether ζ is enhanced in disks within clustered star-forming regions or whether alternative mechanisms contribute to
  formation.
In contrast to interstellar absorption measurements,  emission has been detected in Jupiter’s ionosphere through observations of its ν2 = 2 → 0 overtone at ~2 µm (Drossart et al. 1989) and its fundamental ν2 = 1 → 0 band at ~3.4–4.4 µm (Oka & Geballe 1990). The detection of
  emission in Jupiter, Saturn (Geballe et al. 1993), Uranus (Trafton et al. 1993), and Neptune (Melin et al. 2025) probes solar wind-driven ionospheric and auroral activity. The main source of H2 ionization in planetary ionospheres is high-energy electron impacts,
  , with some contribution from ionization by solar EUV radiation (e.g., Miller et al. 2000, 2020).
 line emission outside the Solar System was first (tentatively) reported in the ejecta of Supernova 1987A (Tennyson & Miller 1994; Lepp & Dalgarno 1991) and in the disk around the Herbig Ae/Be star HD 141569 (Brittain & Rettig 2002). The later detection was disputed by Goto et al. (2005), who did not find any
  lines in follow-up observations. Until now, the most robust detection of interstellar
  emission has come from JWST observations of ultraluminous IR galaxies (ULIRGs, Pereira-Santaella et al. 2024). The detection of ro-vibrational emission raises questions about
  formation and excitation mechanisms (collisional, radiative, or formation pumping; see e.g., Anicich & Futrell 1984; Le Bourlot et al. 2024).
A key feature of dense FUV-irradiated gas is the presence of significant quantities of thermal and FUV-pumped rotationally and vibrationally excited2 H2, hereafter  , which is typically much more chemically reactive than H2(v = 0, J = 0), the dominant form of H2 in cold interstellar gas (Stecher & Williams 1972; Freeman & Williams 1982; Tielens & Hollenbach 1985; Sternberg & Dalgarno 1995; Agúndez et al. 2010). In PDRs,
  initiates a “hot” chemistry, whereby endoergic reactions (endothermic or with activation energy barriers) become active and proceed rapidly. This “state-dependent” chemistry in disks remains poorly characterized (e.g., Walsh et al. 2013; Ruaud 2021), as few reaction rates are known and advanced computational methods are required to determine these rate constants (e.g., Zanchet et al. 2013a,b, 2019; Veselinova et al. 2021; Goicoechea & Roncero 2022). In this study we investigate the chemical pathways through which strong FUV radiation fields trigger the formation of abundant
  via a few specific reactions involving
  . We theoretically investigate two fundamental reactions:
  , which is very endoergic in the left to right direction when v″ < 4 (by ~21 200 K when v″ = 0), and reaction
  , which is endoergic by ~1500K when v″ =0 and J″ = 0 (see Appendices). Using detailed dynamical computations, we determine their vibrational-state dependent rate constants and incorporate them into our model simulating the PDR component of d203-506. In addition, we investigate the role of FUV-photoionization of
  (Ford et al. 1975), another state-dependent process that leads to the formation of
  , and consequently
  .
.
In Sect. 2, we summarize the most relevant properties of d203-506. In Sect. 3, we present our reference model of the disk’s PDR component. In Sect. 4, we dissect this component into three zones and study the dominant chemical formation pathways for  in these zones. In Sect. 5, we present and discuss our photochemical and excitation models.
2 The irradiated disk d203-506 and its emission
The disk d203-506 was first detected in silhouette against the optical background of the Orion Nebula by Hubble (Bally et al. 2000) and later in HCO+ by ALMA (Champion et al. 2017). More recent observations from the Keck Observatory, Very Large Telescope (VLT), and James Webb Space Telescope (JWST) have revealed the extended nature of its PDR component – the irradiated outer disk surface and photoevaporative wind – created by FUV radiation from θ1 Ori C, the most massive O-type star in the Trapezium (Berné et al. 2023, 2024; Haworth et al. 2023; Habart et al. 2024; Goicoechea et al. 2024; Zannese et al. 2024, 2025).
While the exact position (in the line of sight) of d203-506 is uncertain (e.g., Haworth et al. 2023), the Orion Nebula Cluster lies at a distance of ~400 pc (e.g., Kounkel et al. 2018). Berné et al. (2024) determined the mass of the host star (~0.3 M⊙), and the disk’s mass (~ 10 MJup ≃ 10−2 M⊙) and radius (~ 100 au ≃ 0.25″). The estimated flux of the external FUV field, derived from near-IR fluorescent OI and CI emission lines, is G0 ≃ 2 × 10⁴ (Berné et al. 2024; Goicoechea et al. 2024), where G0 is the mean interstellar FUV field in Habing units (G0 = 1 is equal to 1.6×10⁻³ erg cm−2 s−1; Habing 1968). In addition, d203-506 exhibits shock-excited gas from a small jet (HH 520), observed in [Fe II] (Haworth et al. 2023; Berné et al. 2024). Most molecules exhibiting extended emission in the disk’s PDR show their peak near a bright “spot” facing the Trapezium (Berné et al. 2024), which likely corresponds to a column density enhancement, perhaps the interaction region between the PDR and the jet.
This disk is particularly interesting for constraining the effects of FUV radiation, as it does not exhibit ionization fronts produced by EUV radiation (Haworth et al. 2023). In addition, the nearly edge-on orientation of d203-506, with an estimated inclination of i > 75° (based on the non-detection of the internal star; Berné et al. 2024), makes it an excellent target for studying the vertical effects of FUV radiation in the upper disk and neutral wind. This geometry allows for the PDR component to be isolated more easily, since the very high dust optical depth at short wavelengths renders IR observations insensitive to the cold disk midplane and inner disk.
Schroetter et al. (2025b) reported the likely detection of several  emission lines of the v2 = 1 → 0 band, including the R(l,0), Q(1,0), Q(5,G), R(7,0), and R(7,6)u lines3. The higher excitation lines are not detected in the ISM of galaxies (Pereira-Santaella et al. 2024) and suggest higher excitation conditions in d203-506. Although clearly visible in the stacked spectrum, the reported lines are faint and close to the detection limit, leaving the presence of
  emission in d203-506 open to interpretation.
3 Representative model of the externally irradiated outer disk and photoevaporative wind
To guide our interpretation of the  emission in externally irradiated disks, we first present a representative model of their PDR component, its structure, and physical conditions. We assume that at the physical scales probed by JWST, the density distribution is smooth across the inner neutral wind and outer disk surface. Thus, as a first approximation, we adopted a constant density model. We simulated the disk PDR as a 1D stationary slab of gas and dust using an enhanced version of the Meudon PDR4 code v7.0 (Le Petit et al. 2006). Since we were focusing on d203-506, we adopted G0 = 2×10⁴ and ζ = 10−16 s−1 (Berné et al. 2024). Our model solves the λ-dependent attenuation of FUV photons (λ < 912 Å), considering dust extinction and line self-shielding. We treat the λ-dependent absorption and anisotropic scattering of FUV photons by dust grains that follow a uniform size distribution ∞ a−3.5 (Mathis et al. 1977), with amin = 0.02 µm and amax = 1 µm as the minimum and maximum grain radii (for details, see Goicoechea & Le Bourlot 2007). This choice provides a total-to-selective extinction ratio of RV ≃ 5.9 anda dust extinction cross section
  at 1000 Å (absorption plus scattering). While these grains are bigger than ISM grains (where
  is ~3 times larger), they reflect the modest grain growth expected in the upper layers of young irradiated disks (e.g., Störzer & Hollenbach 1999; Birnstiel et al. 2018).
Our detailed treatment of the penetration of FUV radiation, multilevel H2 excitation (up to v = 14), thermal balance, and chemistry allows for the precise determination of the H/H2 and C+/C/CO transition layers, which is crucial for understanding the origin of the  emission. In order to account for the formation of the outer water snow line, the model includes gas-phase chemistry and simple grain surface chemistry for O, OH, H2O, O2, and CO ice mantles (see Putaud et al. 2019; Goicoechea et al. 2021). However, we do not model the different reactivities of ortho- and para-H2 or
  , nor do we compute the vibrational populations of chemical reaction products. In addition, we neglect the wind dynamics (see e.g., Haworth & Owen 2020).
Based on JWST studies of d203-506, we adopted a gas density nH = n(H) + 2n(H2) = 107 cm−3 for its PDR component (Berné et al. 2024; Goicoechea et al. 2024; Zannese et al. 2024, 2025). Figure 1 dissects the physical structure of the PDR as a function of depth (along the external illumination direction and in magnitudes of visual extinction, AV), roughly representing the vertical structure of the outer disk and wind. This figure shows the decreasing gas temperature and increasing H2 density from the PDR edge to the more FUV-shielded disk interior. Figure 2 shows the FUV radiation field (in energy density) at different zones of the disk PDR (in AV). In this plot, we only show the high-energy FUV photon range from 13.6 to 12.6 eV relevant to  photoionization.
Owing to the low G0/nH ratio, the FUV spectrum is significantly blanketed by H2 absorption lines (Fig. 2).
H2 molecules are photodissociated at the very surface of the PDR (AV ≲ 0.2 mag). In these hot and predominantly atomic gas layers, the abundance of H atoms exceeds that of H2. That is, x(H) > x(H2) and f(H2) = 2n(H2)/nH <2/3, where f(H2) is the molecular gas fraction. Owing to the high densities and temperatures, the excited rotational levels of H2(v = 0) become significantly populated by inelastic collisions, with Trot ≈ Tgas. Due to the de-excitation of FUV-pumped H2 electronic levels (Lyman and Werner bands), a significant fraction of the existing H2 resides in excited vibrational states too (v > 0; see the upper panel of Fig. 1). Specifically, the predicted fractional abundance of  molecules in vibrational states v≥4 (relative to those in the ground state) reaches ~ 1% (this fraction increases for lower gas densities, see specific models in Appendix A). A key feature of PDRs is that the enhanced abundance of
  significantly impacts the chemistry and the position5 of the C+/C/CO transition layers. Owing to self-shielding and a reduced FUV flux, H2 becomes more abundant than H at AV > 0.2 mag. This marks the so-called “dissociation front”, where n(H) ≃ n(H2). Most of the IR molecular emission detected by JWST in d203-506 originates from these warm disk layers, where we predict Tgas ≈ 1000 K, in agreement with the observed H2 rotational temperatures (Berné et al. 2024). The lowest panel of Fig. 1 shows a simplified sketch illustrating three zones of the disk PDR (from the outside to the inside): predominantly atomic hot gas at the neutral wind edge (zone i), warm gas near the H/H2 dissociation front (zone ii), and colder, partially FUV-shielded disk gas (zone iii). These zones also correspond to different regimes of the
  chemistry.
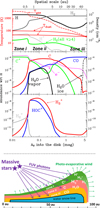 |
Fig. 1 Physical (approximately vertical) structure of d203-506. Upper panel: model profiles of gas density, gas temperature, and a−3.5 grain-size distribution, showing the highest and lowest dust temperatures (corresponding to amin and amax grain radii, respectively) as a function of depth into the PDR. The green curve shows the density of |

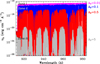 |
Fig. 2 Predicted λ-dependent FUV radiation field at different depth positions from the PDR surface into the disk. We show the local FUV energy density in units of erg cm−3 Å−1, from the Lyman cut to 12.6 eV. |
4 chemistry in three different disk regions
In this section, we introduce the main sources of H2 ionization and the dominant pathways leading to  in the three distinct zones of the disk PDR (Fig. 1). This analysis is based on the dominant
  formation and destruction mechanisms predicted by our reference model of d203-506 across the disk PDR (see the chemical networks in Figure 3).
4.1 Zone i: Predominantly atomic PDR gas
This thin outermost zone (AV < 0.03 mag, less than one astronomical unit, au) is exposed to the nearly unshielded external FUV field and is characterized by very high temperatures (≃ 3000 K in this model), fairly low f(H2), and significant relative abundances of  . The dominant H2 ionization pathway is the reaction
 (2)
(2)
where v″ and v′ denote the vibrational levels of the reactant and product molecules, respectively, in their ground electronic state. This process – both charge transfer (CT) and reactive charge transfer (RCT) – is very endoergic, by about 1.83 eV ≃21 200 K, when v″ = 0 (Ichihara et al. 2000; Krstić et al. 2002; Plasil et al. 2012; Sanz-Sanz et al. 2021). Thus, it is a negligible process in cold molecular gas. However, it becomes accessible at high temperatures (Tgas > 1000 K) and as higher v″ levels of  are populated by de-excitation of FUV-pumped H2. In Appendix B we describe the quantum dynamical methods we used to calculate accurate vibrational-state dependent rate constants for reaction (2). Table 1 summarizes the derived v″-state specific rate constants as well as the thermal6 rate, derived from these constants, in the form of Arrhenius-like fits. For H2(v″) in low vibrational states (v″ < 4) and at warm to cold gas temperatures (Tgas < 1000 K), the reaction (2) is extremely slow (see Fig. 4). However, for v″ ≥ 4 and for Tgas > 1000 K, the CT reaction becomes energetically accessible and the reaction rate much faster.
Given that  formation via cosmic-ray ionization of H2 is negligible in this zone, the central question becomes how hydrogen atoms are ionized. A fraction of H atoms are directly ionized by cosmic rays. In addition, the photodissociation of CH+ and reactions of CO+ with H atoms become significant “chemical sources” of H+ in high-G0 environments. These reactive molecular ions7 are natural products of PDR chemistry (e.g., Sternberg & Dalgarno 1995) and readily form as Tgas and the
  abundance increase in the disk PDR.
In this zone, H+ ions are destroyed by reactions with O atoms,
 (4)
(4)
This resonant CT is endoergic8 when the oxygen atom is the ground fine-structure state (J = 2) (Chambaud et al. 1980; Stancil et al. 1999; Spirko et al. 2003), with a rate constant ∝ exp(–230 K/Tgas). Thus, it is much faster at high Tgas, so that H+ ions follow reaction (4) instead of recombining with electrons. Still, a small fraction of H+ ions forms  through reaction (2). The inverse CT of reaction (4) (H + O+) is exothermic and quickly returns most of the charge to H+.
Although FUV photons (below the Lyman limit) cannot ionize molecular hydrogen when H2 is in its lowest vibrational states (as IP(H2) = 15.43 eV or 124,417.491 cm−1; Liu et al. 2009),  molecules in v″ ≥ 4 can be ionized9 by FUV radiation. That is,
 (5)
(5)
This is a FUV-driven source of H2 ionization, and of electrons, that has not been considered in PDR models before. This mechanism is also a destruction process of H2 levels with v″≥ 4. We determined the role of  photoionization by considering the state-to-state photoionization cross sections,
  , computed by Ford et al. (1975). These cross sections are on the order of ~10−18 cm−2, and require FUV photons with energies above 12.6eV (λ<984 Å, see Fig. 2). Appendix C describes the details of our calculations.
The photoionization rate of  from a given v″ ≥ 4 level, Kphi(H2, v″), is given by
 (6)
(6)
where uλ is the local energy density of the FUV radiation field (in erg cm−3 Å−1) at a given disk position (see Fig. 2). Hence, the total  formation rate due to
  photoionization,
  , is given by
 (7)
(7)
where n(H2, v″) (in cm−3) are the local  level populations.
In zones i and ii, reaction (1) is not the dominant destruction pathway of  . Instead, owing to the high abundance of H atoms, the reverse process of reaction (2),
 (8)
(8)
is the dominant destruction pathway for  . This reaction is very exoergic, and has been investigated in the laboratory (Karpas et al. 1979) and by quantum dynamical methods (Sanz-Sanz et al. 2021). In Appendix B, we summarize how we determined the state-dependent rate constants for this reaction (CT and RCT) in the temperature range Tgas ≃ 100–2000 K. Table 1 shows the computed thermal rate constant – independent of the vibrational state of
  (as we do not explicitly follow the excitation of
  molecules) – that we used in our models. Reactions of
  with H limit the formation of
  in FUV-irradiated gas with relatively low f(H2). In general, reactions involving H atoms can constitute an efficient destruction pathway for molecules at high temperatures because these processes are typically highly endoergic10. However, they only impact a thin layer at the PDR edge, where temperatures are very high and x(H) ≫ x(H2).
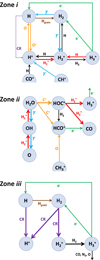 |
Fig. 3 Dominant |


Rate constants discussed in this work.
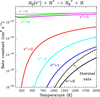 |
Fig. 4 Calculated vibrational-state-specific rate constants of reaction |

4.2 Zone ii: molecular PDR gas
Figure 3 (middle panel) shows the gas-phase reactions leading to  in zone ii, near the dissociation front (at AV ≃ 0.2 mag in this reference model; Fig. 1). Because of its higher gas column density (0.03 < AV < 0.3 mag, corresponding to a vertical scale of ~5–10 au) and elevated temperatures (Tgas ~ 1000 K), zone ii is predicted to be the primary contributor to the observed
  column density in d203-506. Remarkably, the chemistry responsible for
  formation in this zone is largely independent of cosmic-ray ionization, but ultimately related with the presence of enhanced abundances of C+ and water vapor in the outer disk surface. We find that
  forms mainly through reaction
 (9)
(9)
which is endoergic by ~1500 K when v″= 0 (including zero-point energies, ZPEs, see Appendix D and Klippenstein et al. (2010)). These products have been observed in experiments at room temperature (e.g., Freeman et al. 1987). However, there is no evidence of  formation at low temperatures (at least at 25 K; see Smith et al. 2002).
Reaction (9) competes with the isomerization reaction
 (10)
(10)
which is exoergic (Smith et al. 2002). In Appendix D, we describe the ZPE-corrected quasi-classical trajectory dynamical methods we used to calculate the v″ -state-dependent rate constants of reactions (9) and (10). Figure 5 show the resulting rates. We find that for H2(v″ = 0, J″ = 0) and for low gas temperatures (Tgas <100 K), the isomerization reaction (10) is the relevant channel. However, for  , and as Tgas increases, the channel leading to
  becomes increasingly relevant11, and becomes the primary pathway for
  formation in this disk zone.
HOC+ is the less stable isomer of the widespread HCO+ cation. HOC+ is a reactive molecular ion readily seen in interstellar PDRs (e.g., Ziurys & Apponi 1995; Fuente et al. 2003; Liszt et al. 2004; Savage & Ziurys 2004; Goicoechea et al. 2009, 2017). Its main formation pathway is the very exoergic reaction
 (11)
(11)
This reaction has been studied in the laboratory (Martinez et al. 2008; Yang et al. 2021), implying a branching ratio to HOC+ of ≳0.68 because the formation of HCO+ requires carbon insertion into the O–H bond, which is less likely (e.g., Ishikawa et al. 2001). Experimental studies suggest a reaction rate of ≳10−9 cm3 s−1 and a slight inverse temperature dependence (Martinez et al. 2008; Yang et al. 2021). Therefore, the formation of abundant HOC+ (and thus  ) in the disk’s PDR is directly linked to the presence of FUV photons, which can ionize C atoms, and to the existence of abundant water vapor, enabled by elevated gas temperatures.
Figure 3 (middle panel) shows the endoergic gas-phase reactions that lead to the formation of H2O at warm temperatures. The initial step involves the formation of the OH radical,
 (12)
(12)
This reaction is endoergic by E/k ~ 770 K and has an activation barrier of Ea/k ~ 6900 K from H2(v=0) (Veselinova et al. 2021). The second step is reaction
 (13)
(13)
which is exoergic, but has a barrier12 of a few thousand Kelvin. Thus, high Tgas conditions, and the presence of  , lead to water vapor in this PDR zone. All in all, the strong external FUV radiation initiates a cycle of H2O formation, photodissociation, and reformation. This cycle has been observationally confirmed by the detection of rotationally hot OH – the signature of H2O photodissociation – and of vibrationally excited OH – the signature of reaction (12) – in d203-506 (Zannese et al. 2024).
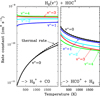 |
Fig. 5 Calculated H2 vibrational-state-specific rate constants of reaction H2(v″) + HOC+ producing |

4.3 Zone iii: Partially FUV-shielded molecular gas
Figure 3 (lower panel) shows the dominant gas-phase reactions leading to  in FUV-shielded (or low illumination) molecular gas, where AV ≳ 5 mag. The initial step involves cosmic-ray ionization of H2:
 (14)
(14)
This is the “standard” chemistry of interstellar clouds with f(H2) → 1 (e.g., Dalgarno 2006). In steady state, the density of  molecules is simply given by
 (15)
(15)
where we consider  formation through reaction (1) and
  destruction through dissociative recombinations with electrons (with a rate constant αe ~ T−0.5) and proton transfer reactions with X = CO, N2, O, and so on, with a rate constant, kx. We note that this expression is independent of the rate constant of reaction (1). In FUV-shielded dense molecular gas, n(e) is typically low, αe n(e) ≪ Σx kx n(x), and
  is proportional to ζ. This regime dominates deeper inside the cold midplane (Tgas < 100 K), but results in lower local
  abundances
  of several 10−11 for ζ = 10−16 s−1 (or several 10−12 if ζ = 10−17 s−1) – compared to the PDR, where
  abundances are typically several 10−8.
5 Discussion
Here, we analyze and discuss our  photochemical and excitation models, along with the sensitivity of the results to variations in the external radiation field and the cosmic-ray ionization rate.
5.1 Photochemical model results
Figure 6 (left panel, upper box) shows the predicted distribution of H2 abundances (relative to the total H2 density) across various rotationally and vibrationally excited H2 levels as a function of depth into the disk. The lower box shows the resulting  ,
,  , and HOC+ abundance profiles. In this box, continuous curves show the results from models that use the specific state-dependent rate constants for reactions (2), (9), (10), and for photoionization of H2(v"≥4). This represents our complete reference model of d203-506. The dotted curves correspond to models that neglect H2(v″≥4) photoionization, which we find to play a minor role at the high gas densities considered. However, this process plays a more dominant role at lower densities due to the more nonthermal relative populations of FUV-pumped H2(v″ ≥ 4) levels (see models in Appendix A). Dashed curves correspond to models neglecting H2 photoionization and using the thermal rate constants computed from the state-to-state rates. Again, this approximation is sufficiently accurate for nH = 107 cm–3, but becomes much less reliable in lower-density gas (see Fig. A.2).
The right panels of Fig. 6 show the formation rate of  from different reactions (upper box), as well as the percentage contribution of different reactions to the total
  formation rate (lower box). In the predominantly atomic PDR (zone i),
  formation is dominated by the reaction
  , but the primary formation pathway for
  is the reaction
  – with a significant supply of H+ from (photo)chemical reactions – along with a minor contribution from the photoionization of
  . The resulting
  abundance in zone i is not very high because destruction reactions with H atoms and dissociative recombinations with electrons are both very efficient. In terms of local abundances, this thin zone is characterized by
  . This further implies that, even in the absence of an ionization front, narrow hydrogen recombination lines could still trace the neutral PDR (see observations by Boyden et al. 2025).
Near the H/H2 dissociation front (disk zone ii),  reaches its peak abundance (~3×10⁻⁸) and column density (- 8.5 × 1012 cm-2). The x(H+ ) profile closely follows that of HOC+ and, consequently, that of water vapor, which locally reaches very high abundances, x(H2O) ~ 10-5, due to the high gas temperatures and the efficiency of reactions (12) and (13) in converting atomic oxygen into H2O. At the x(
 ) peak,
  formation is driven almost exclusively by H2 + HOC+ reactions. In our model, the majority of the
  column density originates from this zone. Its formation is largely independent of cosmic-ray ion-ization and instead depends on the abundance of HOC+. Indeed, the observed distribution of HCO+ J = 4–3 emission in d203-506 – matching that of vibrationally excited
  (Berné et al. 2024), highly rotationally excited OH (i.e., the product of water vapor photodissociation; Zannese et al. 2024), and fluorescent CI emission (Goicoechea et al. 2024) – implies that HOC+, and thus
  , originate from this PDR component.
In the more FUV-shielded and colder molecular gas, where f(H2) → 1 (disk zone iii), most gas-phase carbon becomes locked in CO. As the gas temperature and FUV flux decrease, conditions begin to favor the formation of abundant water ice mantles. Consequently, the gaseous C/O abundance ratio increases. Owing to strong external irradiation – leading to ice-mantle photodesorption and dust grain heating – the vertical position of the water snow line is shifted deeper inward (e.g., Goicoechea et al. 2024) compared to that in isolated disks (e.g., Öberg et al. 2011; Öberg & Bergin 2016). In terms of the ionization fraction, x(H+) and x(e−) decrease drastically in this zone. Here, cosmic rays, X-rays, and perhaps the decay of short-lived radionuclides become the only significant sources of ionization (Cleeves et al. 2013, 2015).  forms through reactions between H2 and
  . However, the local
  abundances are lower – approximately 10−11 for our adopted value of ζ – than in the FUV-irradiated layers, due to less efficient formation and enhanced destruction by proton transfer reactions with CO, N2, and other species. The column density of cold
  in the midplane of a protoplanetary disk remains uncertain, but its IR ro-vibrational emission is expected to be faint. In any case, JWST observations of d203-506 are not sensitive to the cold, deep midplane layers or to the inner regions of the disk near the star.
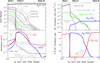 |
Fig. 6 Models of the PDR component in d203-506. Left panels: H2 relative populations and abundances. The upper panel shows the normalized distribution of H2(v) populations across different vibrational levels (solid curves), along with the rotationally excited H2(v = 0, J = 7, 9, 11) levels (dashed curves). The lower panel displays abundance profiles of |


5.2 H3+ excitation and infrared emission in d203-506
Schroetter et al. (2025b) estimated an  column density of ≃1013 cm−2, based on an local thermodynamic equilibrium (LTE) fit to their likely detection of ν2 ro-vibrational lines in d203-506. This corresponds to an abundance
  of a few 10−8, using NH in the disk PDR derived from JWST observations of multiple rotational lines of H2(v = 0) (e.g., Berné et al. 2023, 2024). These values are broadly consistent with our PDR model results, with most of the
  column density arising from PDR zone ii (Figs. 1 and 6). However, it raises questions about how the ν2 bending mode is actually excited, given the very large Einstein Aij coefficients of the observed ro-vibrational lines (≃100 s−1; e.g., Mizus et al. 2017; Bowesman et al. 2023) and the correspondingly high critical densities (ncr ≈ 1013 cm−3) required for collisional exitation – much higher than the typical density in the disk PDR, nH ≈ 107 cm−3.
Due to the low densities (compared to ncr) and the short chemical lifetime of  in the disk PDR – on the order of a few hours and dominated by destruction reactions with electrons and H atoms
  vibrational levels are unlikely to be thermally populated at Tgas through inelastic collisions. Thus, accurate modeling of the vibrational excitation requires one to incorporate the
  chemical formation and destruction rates (F and D, respectively; see Appendix E) into the statistical equilibrium equations governing the ro-vibrational level populations. In particular, when nH ≪ ncr and radiative pumping is not relevant (see also Zannese et al. 2025), the excess energy from an exoergic formation pathway can leave the nascent
  molecule in a vibrationally excited state, thereby driving much of the observed IR ro-vibrational emission.
To test whether the predicted physical conditions and  chemistry in the PDR component of d203-506 can reproduce the reported
  line intensties, we used the single-slab escape-probability code GROSBETA (Black 1998; Tabone et al. 2021; Zannese et al. 2024), an enhanced version of RADEX (van der Tak et al. 2007), to compute a non-LTE excitation model of
  . This code solves the statistical equilibrium equations by accounting for local chemical formation and destruction rates, ro-vibrational collisional excitation, and spontaneous emission. We assume that the ro-vibrational level populations of the nascent
  molecule follow a Boltzmann distribution at an effective formation temperature, Tform. The input parameters are approximately those of disk zone ii: n(H2) = n(H) = 5×106 cm−3, Tgas = 1000 K, and
  (see Appendix E for more details and for the implemented inelastic collisional rates).
Based on our PDR model results,  formation is assumed to be dominated by reaction (9) when H2 is in its ground vibrational state (v″ = 0)13. Thus, we adopt
  from the reference PDR model (see Fig. D.2), and we vary Tform as an input parameter. Adopting Tform = 3000 K, the resulting non-LTE excitation model (see Table 2) matches reasonably well the intensities of the unblended
  lines reported by Schroetter et al. (2025b). Furthermore, a population diagram fit to the synthetic lines from the most populous levels gives
  , which is on the same order as the LTE excitation temperature range estimated by Schroetter et al. (2025b). Therefore, our chemical and excitation models support the detection of
  emission in the PDR component of d203-506 and suggest that
  may be detectable in other strongly irradiated disks.
Since reaction (9) is endoergic by 1500 K when H2 is in the ground vibrational and rotational state (v″ = 0 and J″ = 0), and  (where
  is the energy of the rotational level J″ in Kelvin), this model implies that
  formation in the disk PDR primarily proceeds via exoergic reactions of rotationally excited H2(v″ = 0, J″ ≥7) with HOC+. Given the relatively high densities and temperatures in the PDR component of d203-506, these rotationally excited H2(v″ = 0) levels are significantly populated2. Indeed, their associated IR emission lines are readily detected, corresponding to a rotational temperature of ~950K (e.g., Berné et al. 2023; Zannese et al. 2024), which is very close to the predicted gas temperature in zone ii of the disk PDR (upper panel of Fig. 1). Consistent with this scenario, our PDR model predicts substantial populations of H2(v″ = 0, J″ ≥ 7) in this zone (see the upper left panel of Fig. 6), where the abundance of
  peaks.
Spectroscopic parameters of the IR  lines reported in d203-506 and GROSBETA model predictions (see Appendix E).
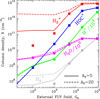 |
Fig. 7 Column densities of H+, |


5.3 H3+ column density as a function of external G0, ζ, and dust grain properties
To isolate the role of increasing G0 and varying ζ cosmic-ray ionization rates, Fig. 7 shows the results of a grid of constant-density models (nH = 107 cm−3) for different strengths of the external FUV field and for a constant ζ = 10−16 s−1. This plot shows increasing column densities of H+,  ,
,  , H2O, and HOC+ as a function of G0. Among these species, N(HOC+) is a particularly good tracer of G0. The continuous curves represent column densities integrated up to AV = 5 mag (i.e., FUV-irradiated gas in the disk PDR), whereas the dashed lines show column densities integrated up to AV = 20 mag (i.e., including FUV-shielded gas representative of the cold disk midplane). When the two curves are close, it indicates that most of the column density of a given species arises from FUV-irradiated gas, near the disk surface, and not from the cold midplane. For G0 < 103, the column densities of these species increase slowly with G0. In this lower-irradiation regime, most of the
  and
and  column density originates from colder gas, partially FUV-shielded, whereas H+, HOC+, and H2O continue to primarily trace the warmer outer disk surface and wind. We recall that our models do not apply to the much denser and hot inner disk regions close to the host star (r < a few astronomical units), where water vapor is highly abundant (with N(H2O) ≳ 1018 cm−2; e.g., Carr & Najita 2008; Pontoppidan et al. 2010; Riviere-Marichalar et al. 2012; Du & Bergin 2014; van Dishoeck et al. 2021; Bosman et al. 2022; Banzatti et al. 2023; van Dishoeck et al. 2023; Smith et al. 2025).
The curves in Fig. 7 represent models with the same value of ζ. Nevertheless, N(H+),  , and
, and  increase significantly with G0, particularly in the high-irradiation regime (G0 > 103). This trend is a clear signature of FUV-driven chemistry and ionization. In the disk’s PDR component, the column density of these species trace the strength of the FUV field, which triggers an active high-temperature photochemistry. To assess the role of ζ in this PDR chemistry, the filled squares in Fig. 7 represent column densities – integrated up to AV = 5 mag – from models with ζ = 10−17 s−1 (a tenfold decrease in the ionization rate). In the PDR component of a strongly irradiated disk (G0 ≳ 103), models with different values of ζ yield very similar results. Therefore, the dependence on ζ is very weak.
The predicted water vapor column densities in the disk PDR (~1014 to several 1015 cm−2) are not high enough to reduce the FUV opacity through water self–shielding (Bethell & Bergin 2009; Bosman et al. 2022), and are also insufficient to produce detectable IR H2O rovibrational emission due to very subthermal collisional excitation and ongoing photodissociation (Zannese et al. 2024). Nonetheless, any dynamical process occurring on timescales comparable to the chemistry – such as the advection of water-ice–coated grains into the PDR surface by the photoevaporative flow (e.g., Maillard et al. 2021; Coleman et al. 2025), followed by ice-mantle photo- and thermal-desorption (e.g., Walsh et al. 2013; Portilla-Revelo et al. 2025) – could enhance the abundance of water vapor at the outer disk surface, and consequently increase the abundances of HOC+ and  beyond our predictions. Alternatively, efficient grain growth, settling to the midplane, and radial drift may progressively remove these icy grains from the upper disk, reducing the gaseous oxygen abundance in the PDR (e.g., Öberg & Bergin 2016; Coleman et al. 2025) and, indirectly, the abundance of
  .
.
The adopted grain-size distribution also impacts the FUV opacity, and thus the penetration of external FUV radiation. Our choice of the size distribution exponent and the amin and amax radii (Sect. 3) is consistent with the modest grain growth expected in the upper layers of a young irradiated disk (e.g., Störzer & Hollenbach 1999). However, over time, the smallest dust grains are expected to be entrained in the photoe-vaporative wind (e.g., Facchini et al. 2016). Both grain growth and dust entrainment reduce  (and increase the dust albedo and anisotropy of the scattered FUV radiation), thereby lowering the FUV opacity and enhancing the penetration of FUV photons (Goicoechea & Le Bourlot 2007). A lower
  value results in a more extended C+ layer and an increased HOC+ column density. However, the higher electron density at the
  abundance peak enhances its destruction, thereby slightly reducing the
  column density. A model with more substantial grain growth,
  at 1000 Å, results in a factor ~1.3 lower
  than the reference model. Detections of
  in other irradiated disks will help to constrain these different scenarios.
5.4 Additional plausible pathways for H3+ formation
Several studies have explored alternative  formation mechanisms in other astrophysical environments. Most of these mechanisms involve reactions with electronically excited states of atomic hydrogen and molecular hydrogen; for instance,
 (16)
(16)
which is a chemiionization process, as well as
 (17)
(17)
which is an associative ionization (e.g., Dehmer & Chupka 1995). In addition, associative ionization involving ground-state and excited states of atomic hydrogen may contribute. That is,
 (18)
(18)
which is endoergic by ~ 12 770 K. The importance of this process was emphasized by Rawlings et al. (1993), and there is both experimental and theoretical support (Urbain et al. 1991, 1992; Hörnquist et al. 2023). The rate coefficient is small for n = 2 at temperatures of interest, but for n > 2, the process is relatively fast (the reaction becomes exoergic). Its contribution to the production of  and
and  will be limited by the populations of high-n states of atomic hydrogen. In the context of protoplanetary disks externally irradiated by both EUV and FUV radiation, recombination near the ionization front might contribute to H(n > 2). However, we suspect that the resonant trapping of Lyman line photons in a very thin layer of the PDR might be a bigger effect in populating excited states. While these associative ionization processes likely produce lower
  column densities compared to the photochemistry and reactions discussed in the previous sections, they may play a larger role in environments such as centers of active or star-forming galaxies. In particular, X-ray-or cosmic-ray-dominated galaxies would naturally have a thicker zone where H, H(n > 2), and H+ coexist than star-powered (PDR) galaxies.
All in all, UV- and X-ray-driven  formation may be relevant also in the inner disk regions (near the host star) as well as in other environments such as exoplanet atmospheres – where
  acts as an important coolant (e.g., Koskinen et al. 2007; Khodachenko et al. 2015) – and the early Universe (e.g., Lepp et al. 2002; Glover & Brand 2003; Coppola et al. 2011, 2013). Our state-dependent rate constants (Table 1) may be valuable for modeling these environments and support the prospect of new
  detections with JWST (e.g., Richey-Yowell et al. 2025).
6 Summary and conclusions
We have presented a detailed photochemical model of the PDR component of a protoplanetary disk – comprising the outer disk surface and photoevaporative wind – exposed to strong external FUV radiation. We have revisited key FUV-driven gas-phase reactions leading to  formation, including new state-to-state dynamical calculations of the vibrational-state v-dependent rate constants for reactions of H2(v) with HOC+ and H+. In addition, we have modeled the photoionization of vibrationally excited H2(v ≥ 4) by FUV, a process new to disk and PDR models.
These reactions dominate the formation of  in the disk PDR, largely independent of the cosmic-ray ionization rate. We conclude that the IR line emission reported by Schroetter et al. (2025b) is consistent with the presence of
  in the PDR component of d203-506. However, our results indicate that
  is not a reliable tracer of ζ in this component, but instead primarily traces the strength of the external FUV field (G0) and gas-phase photochemical processing. Under the conditions of this disk PDR (G0 ≃ 2 × 10⁴ and nH = 107 cm−3), we predict a peak
  abundance of ≳ 10−8 in the irradiated disk surface – corresponding to a column density of
  – where HOC+ is also abundant and plays a dominant role in driving the formation of
  . This reactive molecular ion is ultimately linked to the enhanced abundances of C+ (i.e., due to FUV radiation) and H2O (see also Portilla-Revelo et al. 2025).
Given the relatively low densities (compared to the critical densities of the IR  ν2 = 1 → 0 lines) and the short chemical lifetime of
  in the disk PDR,
  rovibrational levels are unlikely to be thermalized by inelastic collisions with H2, H, or e−. A coupled non-LTE excitation and chemical formation model, with the typical physical conditions of the disk PDR (nH ≃ 107 cm−3 and Tgas ≃ 1000 K), reproduces the IR
  line intensities reported by Schroetter et al. (2025b), provided that formation pumping following exoergic reactions drives most of the
  vibrational excitation. The model supports a scenario in which reactions between rotationally excited H2 (v″ = 0, J″ ≥ 7) and HOC+ account for the reported
  line intensities in d203-506.
Our models show that the abundances of key molecular species (notably molecular radicals and reactive ions) are significantly enhanced in the PDR component of externally irradiated disks. However, their exact abundance depends both on the exact G0/nH value and on grain and PAH properties, which are not well constrained in many disks. Furthermore, the observable IR ro-vibrational spectrum ultimately depends on the underlying excitation mechanism, which is often closely tied to the species’ chemical formation and destruction. Upcoming spectroscopic surveys with JWST and ALMA, targeting tens of protoplanetary disks in clustered environments (e.g., Planet formation environments collaboration 2025), will reveal this chemistry in larger disk samples. The presence of IR  emission will be another signature of FUV-driven chemistry and photochemical processing. It remains to be seen whether face-on disks also exhibit
  features from their inner regions near the host star.
Acknowledgements
We thank the referee for the careful reading of our manuscript and the constructive report. We also thank the PDRs4All team for stimulating discussions over the past few years. JRG and OR thank the Spanish MCINN for funding support under grants PID2023-146667NB-I00 and PID2021-122549NB-C21. We thank the PCMI of CNRS/INSU with INC/INP, co-funded by CEA and CNES.
References
- Adams, F. C. 2010, ARA&A, 48, 47 [NASA ADS] [CrossRef] [Google Scholar]
- Aguado, A., Roncero, O., & Sanz-Sanz, C. 2021, PCCP, 23, 7735 [Google Scholar]
- Agúndez, M., Goicoechea, J. R., Cernicharo, J., Faure, A., & Roueff, E. 2010, ApJ, 713, 662 [Google Scholar]
- Andrianarijaona, V. M., Rada, J. J., Rejoub, R., & Havener, C. C. 2009, J. Phys.: Conf. Ser., 194, 012043 [Google Scholar]
- Andrianarijaona, V. M., Wegley, L. M., Watson, A. Z., et al. 2019, AIP Conf. Proc., 2160, 070005 [Google Scholar]
- Anicich, V. G., & Futrell, J. H. 1984, Int. J. Mass Spectrom. Ion Processes, 55, 189 [Google Scholar]
- Aru, M. L., Maucó, K., Manara, C. F., et al. 2024, A&A, 692, A137 [NASA ADS] [CrossRef] [EDP Sciences] [Google Scholar]
- Aslan, E., Bulut, N., Castillo, J. F., et al. 2012, J. Phys. Chem A, 116, 132 [Google Scholar]
- Bally, J., O’Dell, C. R., & McCaughrean, M. J. 2000, AJ, 119, 2919 [NASA ADS] [CrossRef] [Google Scholar]
- Banzatti, A., Pontoppidan, K. M., Pére Chávez, J., et al. 2023, AJ, 165, 72 [CrossRef] [Google Scholar]
- Bergin, E., Alexander, C., Drozdovskaya, M., Gounelle, M., & Pfalzner, S. 2024, in Comets III, eds. K. J. Meech, M. R. Combi, D. Bockelée-Morvan, S. N. Raymodn, & M. E. Zolensky, 3 [Google Scholar]
- Berné, O., Martin-Drumel, M.-A., Schroetter, I., et al. 2023, Nature, 621, 56 [CrossRef] [Google Scholar]
- Berné, O., Habart, E., Peeters, E., et al. 2024, Science, 383, 988 [Google Scholar]
- Bethell, T., & Bergin, E. 2009, Science, 326, 1675 [NASA ADS] [CrossRef] [Google Scholar]
- Birnstiel, T., Dullemond, C. P., Zhu, Z., et al. 2018, ApJ, 869, L45 [CrossRef] [Google Scholar]
- Black, J. H. 1998, Faraday Discuss., 109, 257 [NASA ADS] [CrossRef] [Google Scholar]
- Black, J. H., & Dalgarno, A. 1977, ApJS, 34, 405 [NASA ADS] [CrossRef] [Google Scholar]
- Bosman, A. D., Bergin, E. A., Calahan, J., & Duval, S. E. 2022, ApJ, 930, L26 [NASA ADS] [CrossRef] [Google Scholar]
- Bowesman, C. A., Mizus, I.I., Zobov, N. F., et al. 2023, MNRAS, 519, 6333 [Google Scholar]
- Boyden, R. D., & Eisner, J. A. 2020, ApJ, 894, 74 [NASA ADS] [CrossRef] [Google Scholar]
- Boyden, R. D., & Eisner, J. A. 2023, ApJ, 947, 7 [Google Scholar]
- Boyden, R. D., Emig, K. L., Ballering, N. P., et al. 2025, ApJ, 983, 81 [Google Scholar]
- Brittain, S. D., & Rettig, T. W. 2002, Nature, 418, 57 [Google Scholar]
- Carr, J. S., & Najita, J. R. 2008, Science, 319, 1504 [Google Scholar]
- Chajia, M., & Levine, R. D. 1999, Phys. Chem. Chem. Phys., 1, 1205 [Google Scholar]
- Chambaud, G., Levy, B., Millie, P., et al. 1980, J. Phys. B At. Mol. Phys., 13, 4205 [Google Scholar]
- Champion, J., Berné, O., Vicente, S., et al. 2017, A&A, 604, A69 [NASA ADS] [CrossRef] [EDP Sciences] [Google Scholar]
- Chu, T.-S., & Han, K.-L. 2005, J. Phys. Chem. A, 109, 2050 [Google Scholar]
- Cleeves, L. I., Adams, F. C., & Bergin, E. A. 2013, ApJ, 772, 5 [Google Scholar]
- Cleeves, L. I., Bergin, E. A., Qi, C., Adams, F. C., & Öberg, K. I. 2015, ApJ, 799, 204 [CrossRef] [Google Scholar]
- Coleman, G. A. L., Haworth, T. J., & Qiao, L. 2025, MNRAS, 539, 1190 [Google Scholar]
- Coppola, C. M., Longo, S., Capitelli, M., Palla, F., & Galli, D. 2011, ApJS, 193, 7 [Google Scholar]
- Coppola, C. M., Galli, D., Palla, F., Longo, S., & Chluba, J. 2013, MNRAS, 434, 114 [Google Scholar]
- Dalgarno, A. 2006, PNAS, 103, 12269 [NASA ADS] [CrossRef] [Google Scholar]
- Dehmer, P. M., & Chupka, W. A. 1995, J. Phys. Chem., 99, 1686 [Google Scholar]
- del Mazo-Sevillano, P., Félix-González, D., Aguado, A., et al. 2024, Mol. Phys., e2183071 [Google Scholar]
- Desch, S., & Miret-Roig, N. 2024, Space Sci. Rev., 220, 76 [CrossRef] [Google Scholar]
- Díaz-Berríos, J. K., Guzmán, V. V., Walsh, C., et al. 2024, ApJ, 969, 165 [CrossRef] [Google Scholar]
- Drossart, P., Maillard, J. P., Caldwell, J., et al. 1989, Nature, 340, 539 [NASA ADS] [CrossRef] [Google Scholar]
- Du, F., & Bergin, E. A. 2014, ApJ, 792, 2 [NASA ADS] [CrossRef] [Google Scholar]
- Errea, L. F., Macías, A., Méndez, L., Rabadán, I., & Riera, A. 2001, Phys. Rev. A, 65, 010701 [Google Scholar]
- Errea, L. F., Macias, A., Méndez, L., Rabadán, I., & Riera, A. 2005, Nucl. Instrum. Methods Phys. Res. B, 235, 362 [Google Scholar]
- Facchini, S., Clarke, C. J., & Bisbas, T. G. 2016, MNRAS, 457, 3593 [NASA ADS] [CrossRef] [Google Scholar]
- Félix-González, D., del Mazo-Sevillano, P., Aguado, A., et al. 2025, A&A, 693, A181 [NASA ADS] [CrossRef] [EDP Sciences] [Google Scholar]
- Ford, A. L., Docken, K. K., & Dalgarno, A. 1975, ApJ, 200, 788 [Google Scholar]
- Freeman, A., & Williams, D. A. 1982, Ap&SS, 83, 417 [CrossRef] [Google Scholar]
- Freeman, C. G., Knight, J. S., Love, J. G., & McEwan, M. J. 1987, Int. J. Mass Spectrom. Ion Processes, 80, 255 [Google Scholar]
- Fuente, A., Rodriguez-Franco, A., Garcia-Burillo, S., Martin-Pintado, J., & Black, J. H. 2003, A&A, 406, 899 [NASA ADS] [CrossRef] [EDP Sciences] [Google Scholar]
- Geballe, T. R., & Oka, T. 1996, Nature, 384, 334 [NASA ADS] [CrossRef] [Google Scholar]
- Geballe, T. R., Jagod, M. F., & Oka, T. 1993, ApJ, 408, L109 [Google Scholar]
- Geballe, T. R., Goto, M., Usuda, T., Oka, T., & McCall, B. J. 2006, ApJ, 644, 907 [NASA ADS] [CrossRef] [Google Scholar]
- Ghosh, S., Sahoo, T., Adhikari, S., Sharma, R., & Varandas, A. J. C. 2015, J. Phys. Chem. A, 119, 12392 [Google Scholar]
- Glover, S. C. O., & Brand, P. W. J. L. 2003, MNRAS, 340, 210 [Google Scholar]
- Goicoechea, J. R., & Le Bourlot, J. 2007, A&A, 467, 1 [NASA ADS] [CrossRef] [EDP Sciences] [Google Scholar]
- Goicoechea, J. R., & Roncero, O. 2022, A&A, 664, A190 [NASA ADS] [CrossRef] [EDP Sciences] [Google Scholar]
- Goicoechea, J. R., Pety, J., Gerin, M., Hily-Blant, P., & Le Bourlot, J. 2009, A&A, 498, 771 [NASA ADS] [CrossRef] [EDP Sciences] [Google Scholar]
- Goicoechea, J. R., Pety, J., Cuadrado, S., et al. 2016, Nature, 537, 207 [Google Scholar]
- Goicoechea J. R. Cuadrado S., Pety J. et al. 2017 A&A 601 L9 [NASA ADS] [CrossRef] [EDP Sciences] [Google Scholar]
- Goicoechea, J. R., Aguado, A., Cuadrado, S., et al. 2021, A&A, 647, A10 [EDP Sciences] [Google Scholar]
- Goicoechea, J. R., Le Bourlot, J., Black, J. H., et al. 2024, A&A, 689, L4 [NASA ADS] [CrossRef] [EDP Sciences] [Google Scholar]
- Goicoechea, J. R., Pety, J., Cuadrado, S., et al. 2025, A&A, 696, A100 [NASA ADS] [CrossRef] [EDP Sciences] [Google Scholar]
- Gómez-Carrasco, S., & Roncero, O. 2006, J. Chem. Phys., 125, 054102 [Google Scholar]
- Gómez-Carrasco, S., González-Sánchez, L., Aguado, A., et al. 2012, J. Chem. Phys., 137, 094303 [CrossRef] [Google Scholar]
- González-Lezana, T., & Honvault, P. 2017, Monthly Not. Roy. Astron. Soc., 467, 1294 [Google Scholar]
- González-Lezana, T., Aguado, A., Paniagua, M., & Roncero, O. 2005, J. Chem. Phys., 123, 194309 [Google Scholar]
- Goto, M., Geballe, T. R., McCall, B. J., et al. 2005, ApJ, 629, 865 [Google Scholar]
- Goto, M., Usuda, T., Nagata, T., et al. 2008, ApJ, 688, 306 [NASA ADS] [CrossRef] [Google Scholar]
- Grozdanov, T. P., & Solov’ev, E. A. 1982, J. Phys. B, 15, 1195 [NASA ADS] [CrossRef] [Google Scholar]
- Habart, E., Peeters, E., Berné, O., et al. 2024, A&A, 685, A73 [NASA ADS] [CrossRef] [EDP Sciences] [Google Scholar]
- Habing, H. J. 1968, Bull. Astron. Inst. Netherlands, 19, 421 [Google Scholar]
- Haworth, T. J., & Owen, J. E. 2020, MNRAS, 492, 5030 [NASA ADS] [CrossRef] [Google Scholar]
- Haworth, T. J., Reiter, M., O’Dell, C. R., et al. 2023, MNRAS, 525, 4129 [NASA ADS] [CrossRef] [Google Scholar]
- Herbst, E., & Woon, D. E. 1996, Astro Phys. J., L113 [Google Scholar]
- Herbst, E., & Klemperer, W. 1973, ApJ, 185, 505 [Google Scholar]
- Hilico, L., Billy, N., Grémaud, B., & Delande, D. 2000, Eur. Phys. J. D, 12, 449 [Google Scholar]
- Hollenbach, D. J., & Tielens, A. G. G. M. 1999, Rev. Mod. Phys., 71, 173 [Google Scholar]
- Hörnquist, J., Hedvall, P., Orel, A. E., & Larson, A. 2023, Phys. Rev. A, 108, 052811 [Google Scholar]
- Huang, S., Portegies Zwart, S., & Wilhelm, M. J. C. 2024, A&A, 689, A338 [NASA ADS] [CrossRef] [EDP Sciences] [Google Scholar]
- Ichihara, A., Shirai, T., & Yokoyama, K. 1996, J. Chem. Phys., 105, 1857 [Google Scholar]
- Ichihara, A., Iwamoto, O., & Janev, R. K. 2000, J. Phys. B At. Mol. Phys., 33, 4747 [Google Scholar]
- Indriolo, N., & McCall, B. J. 2012, ApJ, 745, 91 [NASA ADS] [CrossRef] [Google Scholar]
- Ishikawa, Y., Binning, R. C., & Ikegami, T. 2001, Chem. Phys. Lett., 343, 413 [Google Scholar]
- Jaquet, R., & Kutzelnigg, W. 2008, Chem. Phys., 346, 69 [Google Scholar]
- Joblin, C., Bron, E., Pinto, C., et al. 2018, A&A, 615, A129 [NASA ADS] [CrossRef] [EDP Sciences] [Google Scholar]
- Johnstone, D., Hollenbach, D., & Bally, J. 1998, ApJ, 499, 758 [NASA ADS] [CrossRef] [Google Scholar]
- Kamisaka, H., Bian, W., Nobusada, K., & Nakamura, H. 2002, J. Chem. Phys., 116, 654 [Google Scholar]
- Kaplan, K. F., Dinerstein, H. L., Kim, H., & Jaffe, D. T. 2021, ApJ, 919, 27 [NASA ADS] [CrossRef] [Google Scholar]
- Karpas, Z., Anicich, V., & Huntress, W. T. 1979, J. Chem. Phys., 70, 2877 [NASA ADS] [CrossRef] [Google Scholar]
- Khodachenko, M. L., Shaikhislamov, I. F., Lammer, H., & Prokopov, P. A. 2015, ApJ, 813, 50 [NASA ADS] [CrossRef] [Google Scholar]
- Klippenstein, S. J., Georgievskii, Y., & McCall, B. J. 2010, J. Phys. Chem. A, 114, 278 [Google Scholar]
- Kokoouline, V., Faure, A., Tennyson, J., & Greene, C. H. 2010, MNRAS, 405, 1195 [NASA ADS] [Google Scholar]
- Komasa, J., Piszczatowski, K., Lach, G., et al. 2011, J. Chem. Theory Computat., 7, 3105 [Google Scholar]
- Koskinen, T. T., Aylward, A. D., & Miller, S. 2007, Nature, 450, 845 [CrossRef] [Google Scholar]
- Kounkel, M., Covey, K., Suárez, G., et al. 2018, AJ, 156, 84 [NASA ADS] [CrossRef] [Google Scholar]
- Kraemer, W. P., & Spirko, V. 2010, Chem. Phys., 373, 170 [Google Scholar]
- Krstic, P. S., & Janev, R. K. 2003, Phys. Rev. A, 67, 022708 [Google Scholar]
- Krstic, P. S., Schultz, D. R., & Janev, R. K. 2002, Phys. Scr., 2002, 61 [Google Scholar]
- Kusakabe, T., Pichl, L., Buenker, R. J., Kimura, M., & Tawara, H. 2004, Phys. Rev. A, 70, 052710 [Google Scholar]
- Lada, C. J., & Lada, E. A. 2003, ARA&A, 41, 57 [Google Scholar]
- Last, I., Gilibert, M., & Baer, M. 1997, J. Chem. Phys., 107, 1451 [Google Scholar]
- Le, H.-A., Frankcombe, T. J., & Collins, M. A. 2010, J. Phys. Chem. A, 114, 10783 [Google Scholar]
- Le Bourlot, J., Roueff, E., Le Petit, F., et al. 2024, Mol. Phys., 122, e2182612 [Google Scholar]
- Le Petit, F., Nehmé, C., Le Bourlot, J., & Roueff, E. 2006, ApJS, 164, 506 [NASA ADS] [CrossRef] [Google Scholar]
- Lepp, S., & Dalgarno, A. 1991, in Bulletin of the American Astronomical Society, 23, 1406 [Google Scholar]
- Lepp, S., Stancil, P. C., & Dalgarno, A. 2002, J. Phys. B At. Mol. Phys., 35, R57 [Google Scholar]
- Lindsay, C., & McCall, B. J. 2001, J. Mol. Spectrosc., 210, 60 [Google Scholar]
- Liszt, H., Lucas, R., & Black, J. H. 2004, A&A, 428, 117 [CrossRef] [EDP Sciences] [Google Scholar]
- Liu, J., Salumbides, E. J., Hollenstein, U., et al. 2009, J. Chem. Phys., 130, 174306 [PubMed] [Google Scholar]
- Maillard, V., Bron, E., & Le Petit, F. 2021, A&A, 656, A65 [NASA ADS] [CrossRef] [EDP Sciences] [Google Scholar]
- Markovic, N., & Billing, G. D. 1995, Chem. Phys., 191, 247 [Google Scholar]
- Markus, C. R., & McCall, B. J. 2019, J. Chem. Phys., 150, 214303 [Google Scholar]
- Martinez, Jr., O., Betts, N. B., Villano, S. M., et al. 2008, ApJ, 686, 1486 [NASA ADS] [CrossRef] [Google Scholar]
- Mathis, J. S., Rumpl, W., & Nordsieck, K. H. 1977, ApJ, 217, 425 [Google Scholar]
- Maucó, K., Manara, C. F., Ansdell, M., et al. 2023, A&A, 679, A82 [NASA ADS] [CrossRef] [EDP Sciences] [Google Scholar]
- McCall, B. J., Hinkle, K. H., Geballe, T. R., et al. 2002, ApJ, 567, 391 [NASA ADS] [CrossRef] [Google Scholar]
- McCartney, P. C. E., McGrath, C., McConkey, J. W., Shah, M. B., & Geddes, J. 1999, J. Phys. B: At. Mol. Opt. Phys., 32, 5103 [Google Scholar]
- Melin, H., Moore, L., Fletcher, L. N., et al. 2025, Nat. Astron., 9, 666 [Google Scholar]
- Miller, S., Achilleos, N., Ballester, G. E., et al. 2000, in Astronomy, Physics and Chemistry of H3+, 358, 2359 [Google Scholar]
- Miller, S., Tennyson, J., Geballe, T. R., & Stallard, T. 2020, Rev. Mod. Phys., 92, 035003 [NASA ADS] [CrossRef] [Google Scholar]
- Mizus, I.I., Alijah, A., Zobov, N. F., et al. 2017, MNRAS, 468, 1717 [NASA ADS] [CrossRef] [Google Scholar]
- Öberg, K. I., & Bergin, E. A. 2016, ApJ, 831, L19 [Google Scholar]
- Öberg, K. I., Murray-Clay, R., & Bergin, E. A. 2011, ApJ, 743, L16 [Google Scholar]
- O’dell, C. R., Wen, Z., & Hu, X. 1993, ApJ, 410, 696 [CrossRef] [Google Scholar]
- Oka, T. 1980, Phys. Rev. Lett., 45, 531 [CrossRef] [Google Scholar]
- Oka, T., & Geballe, T. R. 1990, ApJ, 351, L53 [Google Scholar]
- Pereira-Santaella, M., González-Alfonso, E., García-Bernete, I., et al. 2024, A&A, 689, L12 [NASA ADS] [CrossRef] [EDP Sciences] [Google Scholar]
- Pineau des Forets, G., Flower, D. R., Hartquist, T. W., & Dalgarno, A. 1986, MNRAS, 220, 801 [CrossRef] [Google Scholar]
- Planet formation environments collaboration (Allen, M., et al.) 2025, Open J. Astrophys., 8, 54 [Google Scholar]
- Plasil, R., Zymak, I., Jusko, P., et al. 2012, Philos. Trans. Roy. Soc. Lond. Ser. A, 370, 5066 [Google Scholar]
- Pontoppidan, K. M., Salyk, C., Blake, G. A., et al. 2010, ApJ, 720, 887 [CrossRef] [Google Scholar]
- Portilla-Revelo, B., Getman, K. V., Ramírez-Tannus, M. C., et al. 2025, ApJ, 985, 72 [Google Scholar]
- Putaud, T., Michaut, X., Le Petit, F., Roueff, E., & Lis, D. C. 2019, A&A, 632, A8 [NASA ADS] [CrossRef] [EDP Sciences] [Google Scholar]
- Qiao, L., Coleman, G. A. L., & Haworth, T. J. 2023, MNRAS, 522, 1939 [NASA ADS] [CrossRef] [Google Scholar]
- Qu, C., & Bowman, J. M. 2016, J. Phys. Chem. A, 120, 4988 [NASA ADS] [CrossRef] [Google Scholar]
- Ramírez-Tannus, M. C., Bik, A., Cuijpers, L., et al. 2023, ApJ, 958, L30 [CrossRef] [Google Scholar]
- Rawlings, J. M. C., Drew, J. E., & Barlow, M. J. 1993, MNRAS, 265, 968 [NASA ADS] [Google Scholar]
- Richey-Yowell, T., Shkolnik, E. L., Llama, J., Sikora, J., & Smith, P. 2025, AJ, 169, 327 [Google Scholar]
- Riviere-Marichalar, P., Ménard, F., Thi, W. F., et al. 2012, A&A, 538, L3 [NASA ADS] [CrossRef] [EDP Sciences] [Google Scholar]
- Roncero, O., & del Mazo-Sevillano, P. 2025, Comput. Phys. Commun., 308, 109471 [Google Scholar]
- Roncero, O., Andrianarijaona, V., Aguado, A., & Sanz-Sanz, C. 2022, Mol. Phys., 120, e1948125 [Google Scholar]
- Ruaud, M. 2021, ApJ, 916, 103 [CrossRef] [Google Scholar]
- Sahoo, T., Ghosh, S., Adhikaru, S., Sharma, R., & Varandas, A. J. C. 2014, J. Phys. Chem. A, 118, 4837 [Google Scholar]
- Saito, K., Hashimoto, Y., & Takayanagi, T. 2021, J. Phys. Chem. A, 125, 10750 [Google Scholar]
- Sanz-Sanz, C., Aguado, A., Roncero, O., & Naumkin, F. 2015, J. Chem. Phys., 143, 234303 [NASA ADS] [CrossRef] [Google Scholar]
- Sanz-Sanz, C., Aguado, A., & Roncero, O. 2021, J. Chem. Phys., 154, 104104 [Google Scholar]
- Savage, C., & Ziurys, L. M. 2004, ApJ, 616, 966 [NASA ADS] [CrossRef] [Google Scholar]
- Savin, D. W., Krstic, P. S., Haiman, Z., & Stancil, P. C. 2004, AstroPhys. J., 606, L170 [Google Scholar]
- Schroetter, I., Berné, O., Bron, E., et al. 2025a, Nat. Astron. [arXiv: 2505.22314] [Google Scholar]
- Schroetter, I., Berné, O., Goicoechea, J. R., et al. 2025b, A&A, 699, L13 [NASA ADS] [CrossRef] [EDP Sciences] [Google Scholar]
- Shiner, D., Gilligan, J. M., Cook, B. M., & Lichten, W. 1993, Phys. Rev. A, 47, 4042 [NASA ADS] [CrossRef] [Google Scholar]
- Smith, M. A., Schlemmer, S., von Richthofen, J., & Gerlich, D. 2002, ApJ, 578, L87 [Google Scholar]
- Smith, S. A., Romero-Mirza, C. E., Banzatti, A., et al. 2025, ApJ, 984, L51 [Google Scholar]
- Spirko, J. A., Zirbel, J. J., & Hickman, A. P. 2003, J. Phys. B At. Mol. Phys., 36, 1645 [Google Scholar]
- Stancil, P. C., Schultz, D. R., Kimura, M., et al. 1999, A&AS, 140, 225 [NASA ADS] [CrossRef] [EDP Sciences] [Google Scholar]
- Stecher, T. P., & Williams, D. A. 1972, ApJ, 177, L141 [NASA ADS] [CrossRef] [Google Scholar]
- Sternberg, A., & Dalgarno, A. 1995, ApJS, 99, 565 [NASA ADS] [CrossRef] [Google Scholar]
- Störzer, H., & Hollenbach, D. 1999, ApJ, 515, 669 [CrossRef] [Google Scholar]
- Tabone, B., van Hemert, M. C., van Dishoeck, E. F., & Black, J. H. 2021, A&A, 650, A192 [NASA ADS] [CrossRef] [EDP Sciences] [Google Scholar]
- Takayanagi, T., Kurosaki, Y., & Ichihara, A. 2000, J. Chem. Phys., 112, 2615 [Google Scholar]
- Tennyson, J., & Miller, S. 1994, Contemp. Phys., 35, 105 [Google Scholar]
- Tielens, A. G. G. M., & Hollenbach, D. 1985, ApJ, 291, 722 [Google Scholar]
- Tielens, A. G. G. M., Meixner, M. M., van der Werf, P. P., et al. 1993, Science, 262, 86 [NASA ADS] [CrossRef] [Google Scholar]
- Trafton, L. M., Geballe, T. R., Miller, S., Tennyson, J., & Ballester, G. E. 1993, ApJ, 405, 761 [NASA ADS] [CrossRef] [Google Scholar]
- Urbain, X., Cornet, A., Brouillard, F., & Giusti-Suzor, A. 1991, Phys. Rev. Lett., 66, 1685 [Google Scholar]
- Urbain, X., Cornet, A., & Jureta, J. 1992, J. Phys. B At. Mol. Phys., 25, L189 [Google Scholar]
- Urbain, X., de Ruette, N., Andrianarijaona, V. M., et al. 2013, Phys. Rev. Lett., 111, 203201 [Google Scholar]
- Ushakov, V. G., Nobusada, K., & Osherov, V. I. 2001, Phys. Chem. Chem. Phys., 3, 63 [Google Scholar]
- van der Tak, F. F. S., Black, J. H., Schöier, F. L., Jansen, D. J., & van Dishoeck, E. F. 2007, A&A, 468, 627 [NASA ADS] [CrossRef] [EDP Sciences] [Google Scholar]
- van Dishoeck, E. F., Kristensen, L. E., Mottram, J. C., et al. 2021, A&A, 648, A24 [NASA ADS] [CrossRef] [EDP Sciences] [Google Scholar]
- van Dishoeck, E. F., Grant, S., Tabone, B., et al. 2023, Faraday Discuss., 245, 52 [NASA ADS] [CrossRef] [Google Scholar]
- van Terwisga, S. E., & Hacar, A. 2023, A&A, 673, L2 [CrossRef] [EDP Sciences] [Google Scholar]
- Veselinova, A., Agúndez, M., Goicoechea, J. R., et al. 2021, A&A, 648, A76 [NASA ADS] [CrossRef] [EDP Sciences] [Google Scholar]
- Walsh, C., Millar, T. J., & Nomura, H. 2013, ApJ, 766, L23 [NASA ADS] [CrossRef] [Google Scholar]
- Watson, W. D. 1973, ApJ, 183, L17 [NASA ADS] [CrossRef] [Google Scholar]
- Winter, A. J., & Haworth, T. J. 2022, Eur. Phys. J. Plus, 137, 1132 [NASA ADS] [CrossRef] [Google Scholar]
- Winter, A. J., Haworth, T. J., Coleman, G. A. L., & Nayakshin, S. 2022, MNRAS, 515, 4287 [NASA ADS] [CrossRef] [Google Scholar]
- Yang, T., Li, A., Chen, G. K., et al. 2021, Sci. Adv., 7, eabe4080 [Google Scholar]
- Yu, H.-G. 2011, Phys. Scr., 84, 028104 [Google Scholar]
- Zanchet, A., Agúndez, M., Herrero, V. J., Aguado, A., & Roncero, O. 2013a, AJ, 146, 125 [Google Scholar]
- Zanchet, A., Godard, B., Bulut, N., et al. 2013b, ApJ, 766, 80 [NASA ADS] [CrossRef] [Google Scholar]
- Zanchet, A., Lique, F., Roncero, O., Goicoechea, J. R., & Bulut, N. 2019, A&A, 626, A103 [NASA ADS] [CrossRef] [EDP Sciences] [Google Scholar]
- Zannese, M., Tabone, B., Habart, E., et al. 2024, Nat. Astron., 8, 577 [Google Scholar]
- Zannese, M., Tabone, B., Habart, E., et al. 2025, A&A, 696, A99 [NASA ADS] [CrossRef] [EDP Sciences] [Google Scholar]
- Zhu, Y., Tian, L., Song, H., & Yang, M. 2019, J. Chem. Phys., 151, 054311 [Google Scholar]
- Ziurys, L. M., & Apponi, A. J. 1995, ApJ, 455, L73 [Google Scholar]
Although  possesses equilateral triangle symmetry, and therefore lacks a permanent dipole, its vibrational modes can break this symmetry, leading to strong dipole-induced transitions (e.g., Tennyson & Miller 1994; Miller et al. 2020). The only fully allowed transition is the infrared-active asymmetric stretch-bend mode ν2, with a band origin at 2,521.6 cm−1 (~4 µm), first observed in the laboratory by Oka (1980).
Berné et al. (2024) reported the detection of IR H2 lines up to v = 4 originating from the PDR component of d203-506. They also detected highly excited rotational lines of H2(v = 0) up to J = 17. Higher spectral resolution observations of interstellar PDRs such as the Orion Bar show H2 lines in vibrationally excited levels up to v = 12 (Kaplan et al. 2021).
The NIR spectrum of this disk is very rich and additional  lines remain blended with lines of other species (Schroetter et al. 2025b).
 readily reacts with C+ and O to form abundant CH+ and OH (as observed in d203-506; Zannese et al. 2024, 2025). These reactions are highly endoergic when H2 (v = 0, J = 0), but they become fast at high Tgas and when
  is available, even shifting the C+/C transition ahead of the H/H2 dissociation front (see Fig. 1) and triggering the formation of specific molecular species in the PDR.
To distinguish between the role of high gas temperatures and the effect of nonthermal populations of FUV-pumped  on the chemistry, it is useful to determine the thermal rate constants. These are Boltzmann averages of the individual v″-state-specific rate constants, defined as
 (3)
(3)
Figure 4 shows the resulting thermal rates for reaction (2) as a dashed black curve. At low temperatures  , as in most applications involving cold molecular gas, the thermal rate is roughly that of H2(v″ = 0). That is,
  (e.g., Agúndez et al. 2010). In the case of reaction (2), kth is significantly larger than
  because the rate constants increase by orders of magnitude when H2 is vibrationally excited. For reaction (9), the differences between
  and
and  are not that large, and kth becomes slightly higher than
  at high temperatures, where the vibrationally excited levels start to be populated.
Reactive ions such as  , CH+, and HOC+ are transient molecules for which the timescale of reactive collisions (leading to molecular destruction) is comparable to or shorter than that of inelastic collisions (e.g., Black 1998). Properly treating their molecular excitation usually requires incorporating chemical formation and destruction rates into the statistical equilibrium level equations (see Appendix E).
The H2(v=4, J=0) level is at an energy of 1.89 eV (or 21504.7 cm−1) above the ground state (e.g., Komasa et al. 2011). Thus, FUV photons with  produce ionization and lead to
  .
.
Our chemical network includes endoergic reactions of H atoms with  , HCO+, HOC+ (Table 1), and other molecules. If the forward rate is not known, we adopt the rate constant of the reverse reaction multiplied by e-ΔE/T, where ΔE is the endothermicity of the forward reaction (see e.g., Pineau des Forets et al. 1986).
Reaction (9) becomes exoergic for  in v″ = 0 and J″ ≥ 4.
Since state-dependent rate constants, kv,J(Tgas), do not exist for reaction (13), we modeled them by adopting state-dependent rate constants where the energy Ev,J of each  ro-vibrational state is subtracted from the reaction barrier ΔΕ (when ΔΕ > Ev,j).
The contribution of H2(v″ ≥ 1) levels to  formation via reaction (9) is less than 10% at the
  column density peak (see Fig. D.2).
Appendix A Application to lower-density PDRs
In this Appendix we model a lower-density PDR, resembling either interstellar PDRs such as the Orion Bar or low-density photoevaporative winds. In the Orion Bar, while G0 is also a few 104, the gas density is lower, about 5×104 cm−3 in the predominantly atomic PDR, and up to ~ 106 cm−3 in the densest molecular gas condensations (e.g., Tielens et al. 1993; Goicoechea et al. 2016). Figure A.1 shows the predicted structure of the PDR (analogous to Fig. 1) for an isobaric model (i.e., with a density gradient) with Pth =108 K cm−3 and G0 =2×10⁴ (e.g., Joblin et al. 2018). This lower gas density produces a more spatially extended atomic PDR, and a H/H2 transition zone located about ten times deeper in AV. In addition, the populations of the vibrationally excited H2(v) levels deviate further from thermal equilibrium populations, reaching higher abundances relative to H2(v = 0) than in the d203-506 model due to the more prominent role of FUV pumping at higher G0/nH values (see the upper panel of Fig. A.2). However, due to lower gas densities, lower shielding, and enhanced photodissociation, the water abundance at the PDR surface is significantly less abundant, with x(H2O) ≲ 10−7.
The more significant role of nonthermal H2(v) populations becomes evident when comparing the use of state-to-state versus thermal rates for reactions (2), (9) and (10). The latter approximation underestimates the  and
and  abundances by nearly two orders of magnitude in the atomic PDR zone. Compared to the d203-506 model, we find a less prominent role of the reaction H2(v) + H+ in the surface layer of the PDR (partially due to lower gas temperatures), while H2 (v ≥ 4) photoionization becomes more significant. In addition, we predict x(e−) > x(C+) in this zone. In any case, most of the
  column density originates from deeper layers of the molecular PDR, where the peak
  abundance is a few ×10−9. This is more than an order of magnitude lower than the
  peak in the disk model, and is a result of the two orders of magnitude lower water vapor abundance, and thus lower HOC+ abundance. Instead, the reaction
  , which is also related to the presence of C+, CH+, and
  (Berné et al. 2024; Zannese et al. 2025; Goicoechea et al. 2025), plays a more significant role (see Fig. A.3). All in all, the total
  column density in this lower-density PDR model is ~1012 cm−3. Still, about 70% of the
  column arises from FUV irradiated gas at AV < 1 .5 mag. In this PDR zone,
  formation is not related to ζ.
Appendix B Charge transfer 
The CT reactions for the formation and destruction of  take place in three electronic states, each one corresponding to a charge in one hydrogen atom, for an electron spin zero, the singlet states. The ground adiabatic electronic state presents a deep well (see Fig. B.1), corresponding to the
  system, leading to H+ + H2 in the three possible rearrangement channels. The two adiabatic excited ones are repulsive and correlate to
  , and present high barriers for the reaction. The direct and backward reactions can result in either simple CT, with no hydrogen exchange (non-reactive), or RCT, in which both charge transfer and hydrogen exchange occur. The latter involves products forming through a rearrangement channel different from the initial one, as illustrated in Fig. B.1 by the green horizontal line, which exists only in the ground adiabatic electronic state.
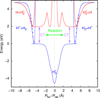 |
Fig. B.1 Minimum energy path of the two lower adiabatic singlet electronic states of the |


Appendix B.1 Reaction 
The cross section of the reaction  was obtained by Sanz-Sanz et al. (2021) using a quantum wave packet method, based on the coupled electronic potential energy surfaces (PESs) calculated by Aguado et al. (2021), where a detailed description of the reaction dynamics is provided. The state-dependent CT and RCT rate constants are obtained here by numerical integration over the collision energy with a Boltzmann energy distribution, and is presented in Fig. B.2. The total (CT+RCT) rate constant is good agreement with the experimental measurement at 300 K by Karpas et al. (1979). McCartney et al. (1999) also studied this reaction, but at much higher energies of 30-100 keV, out of the scope of this study. More recently, Andrianarijaona et al. (2009, 2019) studied the
  isotopic variant in a broader energy range of 0.1-100 eV. Their results show a good agreement with the wave packet calculations performed using the same coupled (Roncero et al. 2022).
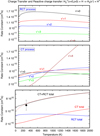 |
Fig. B.2 State-dependent rate constants for the reaction |


Below 1000 K the RCT process dominates, involving a transition from the excited to the ground state, where the reaction takes place within the deep well due to the formation of  well. Due to the formation of long-lived
  complexes, the reaction behaves nearly statistically (González-Lezana et al. 2005; González-Lezana & Honvault 2017).
The vibrational distribution of H2(v′ ) formed by the direct CT process shows some differences. v′ = 0,1 and 2 are very close to each other, while the v′= 4 grows very fast once it is open at about 250 K. The reason is that the H2(v′ = 4) + H+ energy is very close to that of the  reactants, and this small energy difference increases the efficiency of the non-adiabatic couplings between the two electronic states from very long distances, in the so-called resonant effect (Sanz-Sanz et al. 2021).
Several approximate theoretical treatments have been applied to this reverse reaction (Last et al. 1997; Kamisaka et al. 2002; Krstić et al. 2002; Krstic & Janev 2003; Errea et al. 2005), but the present calculations and results are considered the most accurate to date, as validated by the good agreement with the experimental value reported by Karpas et al. (1979).
Appendix B.2 State-dependent rate constants for the endoergic reaction 
The direct reaction H++H2 has been widely studied at energies above the opening of the CT  channel, at 1.82 eV (Markovic & Billing 1995; Ichihara et al. 1996; Last et al. 1997; Chajia & Levine 1999; Takayanagi et al. 2000; Ushakov et al. 2001; Ichihara et al. 2000; Errea et al. 2001; Kamisaka et al. 2002; Krstić & Janev 2003; Savin et al. 2004; Kusakabe et al. 2004; Chu & Han 2005; Urbain et al. 2013; Sahoo et al. 2014; Ghosh et al. 2015). Particularly relevant for this study are the studies by Ichihara et al. (2000) and Krstić et al. (2002), in which this reaction was studied in a very large range of energies, up to a few eV, for different initial vibrational states of H2, using approximate methods. Ichihara et al. (2000) used a quasi-classical (QCT) method including electronic transitions based in a Landau-Zener model, which is restricted to the crossing region between H2+H+ and
  (see Fig. B.1). Krstić et al. (2002) applied a quantum time independent close coupling method, but using an Infinite Order sudden (IOSA) approximation, which freezes the internal angle and decouples the helicities. Both approaches treat approximately the reactivity, making necessary a more accurate method for temperatures below –2000 K.
In this study, we use a quantum wave packet method that includes all degrees of freedom and can be considered “exact” for treating reactivity up to –2000 K. The calculations are similar to those performed for the reverse reaction (Sanz-Sanz et al. 2021), as described in Appendix B, and are carried out using the MAD-WAVE3 code (Roncero & del Mazo-Sevillano 2025). This code represents the Hamiltonian in reactant Jacobi coordinates within a body-fixed frame, employing grids for the internal coordinates (the Jacobi distances r and R, associated with the H2 internuclear vector and the vector joining the H2 center of mass with H+, respectively), and a basis for the electronic coordinates and total angular momentum J, characterized by the quantum number J and its projections M and Ω on the space-fixed and body-fixed z-axes, respectively.
Due to the presence of the deep  potential well, a large number of Ω projections is required to achieve convergence. In this work, we use Ωmax = min(J, 15). The flux into individual final states of the
  products is evaluated using a reactant-to-product coordinate transformation method (Gómez-Carrasco & Roncero 2006), applied separately for each J. To reduce computational cost, we explicitly calculate J = 0, 5, 10, 20, 30, 40, and 60. For intermediate J values, the state-to-state reaction probabilities are interpolated using the J-shifting method (Aslan et al. 2012).
The total CT cross section (CT + RCT) for different initial H2(v, j = 0) are shown in the bottom panel of Fig. B.3. The threshold for the CT is at 1.79 eV, so that the reaction is endothermic for v < 4, leading to negligible reactive cross sections below 0.4 eV for v=0-3 (see Fig. B.1). However, for v ≥ 4 the CT reaction becomes energetically accessible and the cross section becomes important, between 50 and 200 Å2 for v=4, 5 and 6. Qualitatively this result is similar to those reported previously by Ichihara et al. (2000) in their Fig. 1 and by Krstić et al. (2002) in Fig. 1. However, we consider the magnitude of the exact quantum results obtained in this work is considerably more precise. For example, for v = 6 below 2.5 eV, the total cross section is always lower than 40 Å2 (Ichihara et al. 2000), while here is between 100-200 Å2. The large differences is attributed to classical character of the CT, made with a simple Landau-Zenner model. The IOSA results of Krstić et al. (2002) for v=4 shows a threshold, which is absent here.
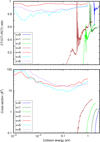 |
Fig. B.3 Upper panel: Fraction of the CT cross section as a function of v. Botom panel: Total reactive cross sections (CT and RCT) for the reaction |

The CT/(CT+RCT) ratio shown in the top panel of Fig. B.3 demonstrates that the dominant process is the simple CT without reaction. The RCT process acounts for a maximum of 30% for v ≥ 4, while is dominant for the lower v < 4. This trend is also similar to the values reported by Ichihara et al. (2000) in the low energy region. We find that for v > 6 the total CT cross section progressively diminish with increasing v. Moreover, it is difficult to extend the present quantum calculations calculations above v = 6, because it is very close to the three-body fragmentation channel, and we shall adopt here the behavior by Ichihara et al. (2000).
The CT rate constant are obtained by numerical integration of the cross section with a Boltzmann distribution. Figure 4 shows the enhancement of the reaction rate as the vibrational excitation of the initial H2 increases, becoming very similar for v = 4,5 and 6, close to the Langevin value, with a rate constant of ≃ (2-4)×10−10 cm3 s−1.
The final  products populate progressively more excited vibrational states with increasing initial H2(v), as shown in Fig. B.4. For example, for an initial state of v = 6, the dominant final state is v′ = 3. Moreover, the reaction
  was recently studied for initial vibrational states v = 0–6, and it was found that, up to collision energies of 1 eV, the reactive cross section is nearly independent of v, with values very close to the Langevin limit (del Mazo-Sevillano et al. 2024). At higher collision energies, however, the reactive cross section increases with v.
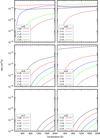 |
Fig. B.4 State-to-state reactive rate constants (CT and RCT) for the reaction |

Appendix C Photoionization of 
Figure C.1 shows the state-to-state  photoionization cross sections adopted in our photochemical models for reaction (5). These cross sections were computed by Ford et al. (1975) and are provided for photoionization, where the product
  is formed in a specific vibrational level v′. Hence, the result is a superposition of step functions, each corresponding to a different value of v′. These calculations only consider rotational transitions J″ = 1 → J′ = 1. Here we explicitly calculated the FUV photon energy thresholds (Et) for each state-to-state process, from v″ =4 to 14 and leading to vibrationally excited
  . Specifically, we used the energy of the H2(v″≥4, J″ = 1) levels (Komasa et al. 2011) and of
  levels (Jaquet & Kutzelnigg 2008; Hilico et al. 2000) and computed:
 (C.1)
(C.1)
where EI is the H2 ionization energy (15.426 eV, e.g., Shiner et al. 1993) and  .
.
Since we do not explicitly follow the vibrational excitation of  molecules, we use
  and integrate these σλ (v″) sections cross sections over the local FUV energy density at different disk positions (equation 6). Figure C.2 shows the resulting rates for the specific model of d203-506 (normalized to G0 = 1). To simplify their use in the Meudon PDR code, we carried out v″-state-dependent power-law fits, of the form κphi(v″;AV) = G0κ0(v″)exp(–γ(v″)AV), to these rates (in s−1). The κ0(v″) and γ(v″) parameters are tabulated inside the code, and used to determine the total
  formation rate due to
  , summed over all v″ levels, FUV photoionization.
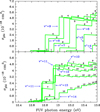 |
Fig. C.1 Cross sections for FUV photoionization of |


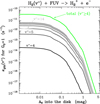 |
Fig. C.2 Resulting H2(v″ ≥4) photoionization rates (normalized to G0 = 1) as a function of depth into the disk after direct integration of equation (6) using the λ-dependent FUV field of our model of d203-506. In this model, the largest contribution to H2(v″ ≥ 4) photoionization comes from the v″ = 10 level. |
Appendix D State-dependent rate constants for reaction  and isomerization
The title reaction has been studied experimentally. Freeman et al. (1987) measured a rate constant of 4.7 × 10⁻¹⁰ cm3 s−1 at 300 K. At a lower temperature of 25 K, however, Smith et al. (2002) did not detect  formation, observing only the isomerization product HCO+. Herbst & Woon (1996) calculated the stationary points on the corresponding potential energy surface, finding a submerged barrier. From this, they proposed that the reaction may proceed via an isomerization route forming HCO+ + H2 (a highly exothermic pathway), or alternatively form
  , which is endothermic by 0.14 eV (including ZPEs). As a result, the latter pathway was considered unimportant.
Most theoretical studies have focused on the HOC+/HCO+ isomerization ratio in the  reaction (Le et al. 2010; Yu 2011; Zhu et al. 2019; Saito et al. 2021). Yu (2011) investigated the H2 + HOC+ reaction using on-the-fly classical trajectory simulations at a relatively low level of theory (SAC-MP2), and did not report the formation of
  products.
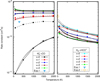 |
Fig. D.1 H2(v = 0–4, j = 0) + HOC+, obtained using a QCT method, are shown with and without the ZPE correction for the |

In this work, we study the title reaction using the high-level potential energy surface (PES) developed by Zhu et al. (2019). This PES reveals an endothermic direct pathway from reactants to products, with an energy difference of 0.125 eV—slightly lower than the value reported by Herbst & Woon (1996). Along the entrance channel, the reaction dynamics can also proceed through a submerged barrier (–0.085 eV including ZPE) toward a deep H2–HCO+ well, from which the system evolves to H2 + HCO+ products. These products lie approximately 1.75 eV below the H2 + HOC+ reactants.
In order to study the  reaction, it is important to account for the ZPEs of both reactants and products. Here, we employ a quasi-classical trajectory (QCT) method, as implemented in the MDwQT code (Sanz-Sanz et al. 2015), in which the initial vibrational conditions of the reactants are generated using the adiabatic switching method (Grozdanov & Solov’ev 1982; Qu & Bowman 2016). This approach allows us to include the vibrational energy of H2 in different vibrational levels, as well as that of HOC+ in its ground vibrational state (with a ZPE of 0.336 eV, consistent with the values reported by Kraemer & Spirko (2010)).
The rate constants obtained in the T ≃ 100—2000 K range are shown in Fig. D.1 for several initial vibrational states of H2. For each case, two sets of results are presented: one including all reactive trajectories (dashed lines), and another excluding those trajectories that result in product vibrational energies below the corresponding ZPE. The  formation is strongly affected by this correction. The ZPE-corrected results are reliable because the formation of
  proceeds through a direct mechanism. Thus, selecting trajectories with physically meaningful vibrational energies at both the beginning and the end effectively mitigates potential inaccuracies introduced by classical mechanics calculations.
For H2(v = 0), the ZPE-corrected rate constants decrease significantly with decreasing temperature. This trend is consistent with the absence of  products in the experimental study by Smith et al. (2002). On the other hand, the rate constant measured for isomerization toward HCO+ (yellow point in the right panel of Fig. D.1) is in good agreement with the calculated rates.
The value reported by Freeman et al. (1987) at 300 K for  formation is much higher than our rate constant for initial H2(v = 0) but slightly lower than the calculated rates for H2(v = 1). To reconcile these differences, we suspect that the HOC+ reactants in the Freeman et al. (1987) experiment may have been vibrationally excited. This assumption allows us to provide a coherent interpretation that integrates all available experimental and theoretical data.
Figure D.2 shows the evolution of the vibrational-state dependent  formation rate, F (in cm−3 s−1), for the reaction
  , after incorporating the rate constants from Fig. D.1 into our reference PDR model.
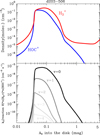 |
Fig. D.2 Upper panel: |


Appendix E Coupled non-LTE excitation and chemical formation model of 
We briefly describe the non-LTE excitation models carried out with the zero-dimensional (0D) escape-probability radiative transfer model GROSBETA (Black 1998; Tabone et al. 2021; Zannese et al. 2024), an enhanced version of RADEX (van der Tak et al. 2007). We used this model to test whether the physical conditions and  chemistry predicted by our PDR model can reproduce the IR
  line intensities reported in d203-506 (Schroetter et al. 2025b). GROSBETA solves the statistical equilibrium equations by accounting for local chemical formation and destruction rates, ro-vibrational collisional excitation, spontaneous emission, and line opacities providing physically consistent predictions of the emergent line intensities under non-LTE excitation conditions.
A proper treatment of  vibrational excitation must account for the chemical formation and destruction rates within the statistical equilibrium equations that govern the ro-vibrational level populations. These equations take the form:
 (E.1)
(E.1)
 (E.2)
(E.2)
where ni [cm−3] is the population of ro-vibrational level i; Aij and Bij are the Einstein coefficients for spontaneous and stimulated emission, respectively; and Cij [s−1] is the rate of inelastic collisions. The latter is given by Cij = Σk γij,k (T) nk, where γij,k(T) [cm3 s−1] are the temperature-dependent collisional rate coefficients, and k denotes collision partners H2, H, or e−. The term  represents the mean intensity of the radiation field averaged over the line profile and solid angle. In the above expression, Fi is the formation rate into level i per unit volume, and ni Di is the destruction rate from level i per unit volume, both in cm−3 s−1 . Assuming a level-independent destruction rate (Di = D), one can model the ro-vibrational level distribution of newly formed
  molecules as a Boltzmann distribution characterized by a formation temperature Tform, where
 (E.3)
(E.3)
and F [cm−3 s−1] is the total (state-averaged) formation rate per unit volume, gi is the degeneracy of level i, and Q(Tform) is the  partition function at the formation temperature Tform.
As these are constant column density  excitation models, we used a normalized formation rate F = Σ Fi that adopts steady-state
  abundances. That is,
 ![$F = \sum {{F_i} = x} \left( {{\rm{H}}_3^ + } \right)\,{n_{\rm{H}}}\,D\,\left[ {{\rm{c}}{{\rm{m}}^{ - 3}}\,{{\rm{s}}^{ - 1}}} \right]$](/articles/aa/full_html/2025/11/aa55842-25/aa55842-25-eq300.png) , where x refers to the
, where x refers to the  abundance with respect to H nuclei, and D is the chemical destruction rate in s−1.
Appendix E.1 Model input
We included 748  vibrational-rotational levels with J < 9, except for the (9,9) metastable level, and nearly 29 000 radiative transitions. The spectroscopic data have been taken from the ExoMol MiZATeP data set (Mizus et al. 2017; Bowesman et al. 2023). The
  and
and  inelastic rotational collision rates are taken from Gómez-Carrasco et al. (2012) and Félix-González et al. (2025), respectively. The inelastic electron collision rates are taken from Kokoouline et al. (2010) plus our own Coulomb-Born rate approximation for the vibrational transitions. In addition, we have included some approximate rate coefficients for
  and
and  vibrational collisional excitation. The typical magnitude of the relevant de-excitation rate coefficients is γij ≳ 10−11 cm3 s−1.
The input parameters are representative of zone ii in the disk PDR: n(H2) = n(H) = 5×106 cm−3, n(e) = 300 cm−3, Tgas = 1000K, and  . Based on our PDR model results,
  formation is assumed to be dominated by reaction (9) when H2 is in its ground vibrational state (v″ =0). Therefore, we adopt a formation rate of
  (see detailed predictions in Fig D.2). Thus, the chemical destruction rate of
  is
is  (or a lifetime of 2.8 h), adopting
  and nH = 107 cm−3.
Finally, we adopted an intrinsic line widths of 2.7 km s−1 as indicated by velocity-resolved ALMA observations of d203-506 (Berné et al. 2024; Goicoechea et al. 2024), and obtained the synthetic line flux by adopting a source emitting area with a solid angle equivalent to an aperture of 0.1″, consistent with the line fluxes extracted by Schroetter et al. (2025b) from JWST/NIRSpec observations.
Appendix E.1 Model results
Adopting a formation temperature of  K–corresponding to
  being primarily formed via reactions between H2(v″=0; J″≥7) and HOC+–results in a non-LTE excitation model that is consistent the intensities of the unblended
  ro-vibrational lines reported by Schroetter et al. (2025b) to within a factor of about two. Table 2 shows the output of this excitation model.
In addition, we also find implications for the  forbidden pure rotational emission spectrum, which has yet to be observed in the ISM. Due to its symmetric, equilateral triangular structure,
  lacks a permanent electric dipole moment. Ordinarily, this would imply that pure rotational transitions are strictly forbidden. However, the symmetry of
  is slightly broken by rotationvibration coupling, which induces a weak dipole moment. As a result, radiative transitions between rotational levels that comply with selection rules are permitted, though they are very slow. Our model suggests that the most intense transition of
  in the parameter space of interest is the pure rotational transition (J, K) = (5,0) – (4,3) at 16.325 µm. The transition frequency has been accurately predicted from measured combination differences by Markus & McCall (2019). Our non-LTE model predicts an intensity that is rather close to the 3σ detection limit on integrated intensity in the JWST-MIRI spectrum of d203-506. In other words, the column density of
  at Tgas ≃ 1000 K cannot be much larger than 1013 cm−2, otherwise this 16.325 µm line should be detected above the strong continuum.
All Tables
Spectroscopic parameters of the IR lines reported in d203-506 and GROSBETA model predictions (see Appendix E).
All Figures
|
Fig. 1 Physical (approximately vertical) structure of d203-506. Upper panel: model profiles of gas density, gas temperature, and a−3.5 grain-size distribution, showing the highest and lowest dust temperatures (corresponding to amin and amax grain radii, respectively) as a function of depth into the PDR. The green curve shows the density of |
| In the text | |
|
Fig. 2 Predicted λ-dependent FUV radiation field at different depth positions from the PDR surface into the disk. We show the local FUV energy density in units of erg cm−3 Å−1, from the Lyman cut to 12.6 eV. |
| In the text | |
|
Fig. 3 Dominant |
| In the text | |
|
Fig. 4 Calculated vibrational-state-specific rate constants of reaction |
| In the text | |
|
Fig. 5 Calculated H2 vibrational-state-specific rate constants of reaction H2(v″) + HOC+ producing |
| In the text | |
|
Fig. 6 Models of the PDR component in d203-506. Left panels: H2 relative populations and abundances. The upper panel shows the normalized distribution of H2(v) populations across different vibrational levels (solid curves), along with the rotationally excited H2(v = 0, J = 7, 9, 11) levels (dashed curves). The lower panel displays abundance profiles of |
| In the text | |
|
Fig. 7 Column densities of H+, |
| In the text | |
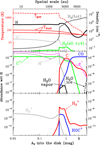 |
Fig. A.1 Same as Fig. 1 but for the isobaric model of the Orion Bar. |
| In the text | |
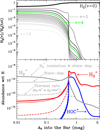 |
Fig. A.2 Same as Fig. 6 (left panels) but for the model of the Orion Bar. |
| In the text | |
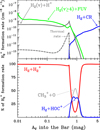 |
Fig. A.3 Same as Fig. 6 (right panels) but for the model of the Bar. |
| In the text | |
|
Fig. B.1 Minimum energy path of the two lower adiabatic singlet electronic states of the |
| In the text | |
|
Fig. B.2 State-dependent rate constants for the reaction |
| In the text | |
|
Fig. B.3 Upper panel: Fraction of the CT cross section as a function of v. Botom panel: Total reactive cross sections (CT and RCT) for the reaction |
| In the text | |
|
Fig. B.4 State-to-state reactive rate constants (CT and RCT) for the reaction |
| In the text | |
|
Fig. C.1 Cross sections for FUV photoionization of |
| In the text | |
|
Fig. C.2 Resulting H2(v″ ≥4) photoionization rates (normalized to G0 = 1) as a function of depth into the disk after direct integration of equation (6) using the λ-dependent FUV field of our model of d203-506. In this model, the largest contribution to H2(v″ ≥ 4) photoionization comes from the v″ = 10 level. |
| In the text | |
|
Fig. D.1 H2(v = 0–4, j = 0) + HOC+, obtained using a QCT method, are shown with and without the ZPE correction for the |
| In the text | |
|
Fig. D.2 Upper panel: |
| In the text | |
Current usage metrics show cumulative count of Article Views (full-text article views including HTML views, PDF and ePub downloads, according to the available data) and Abstracts Views on Vision4Press platform.
Data correspond to usage on the plateform after 2015. The current usage metrics is available 48-96 hours after online publication and is updated daily on week days.
Initial download of the metrics may take a while.