Fig. B.2
Download original image
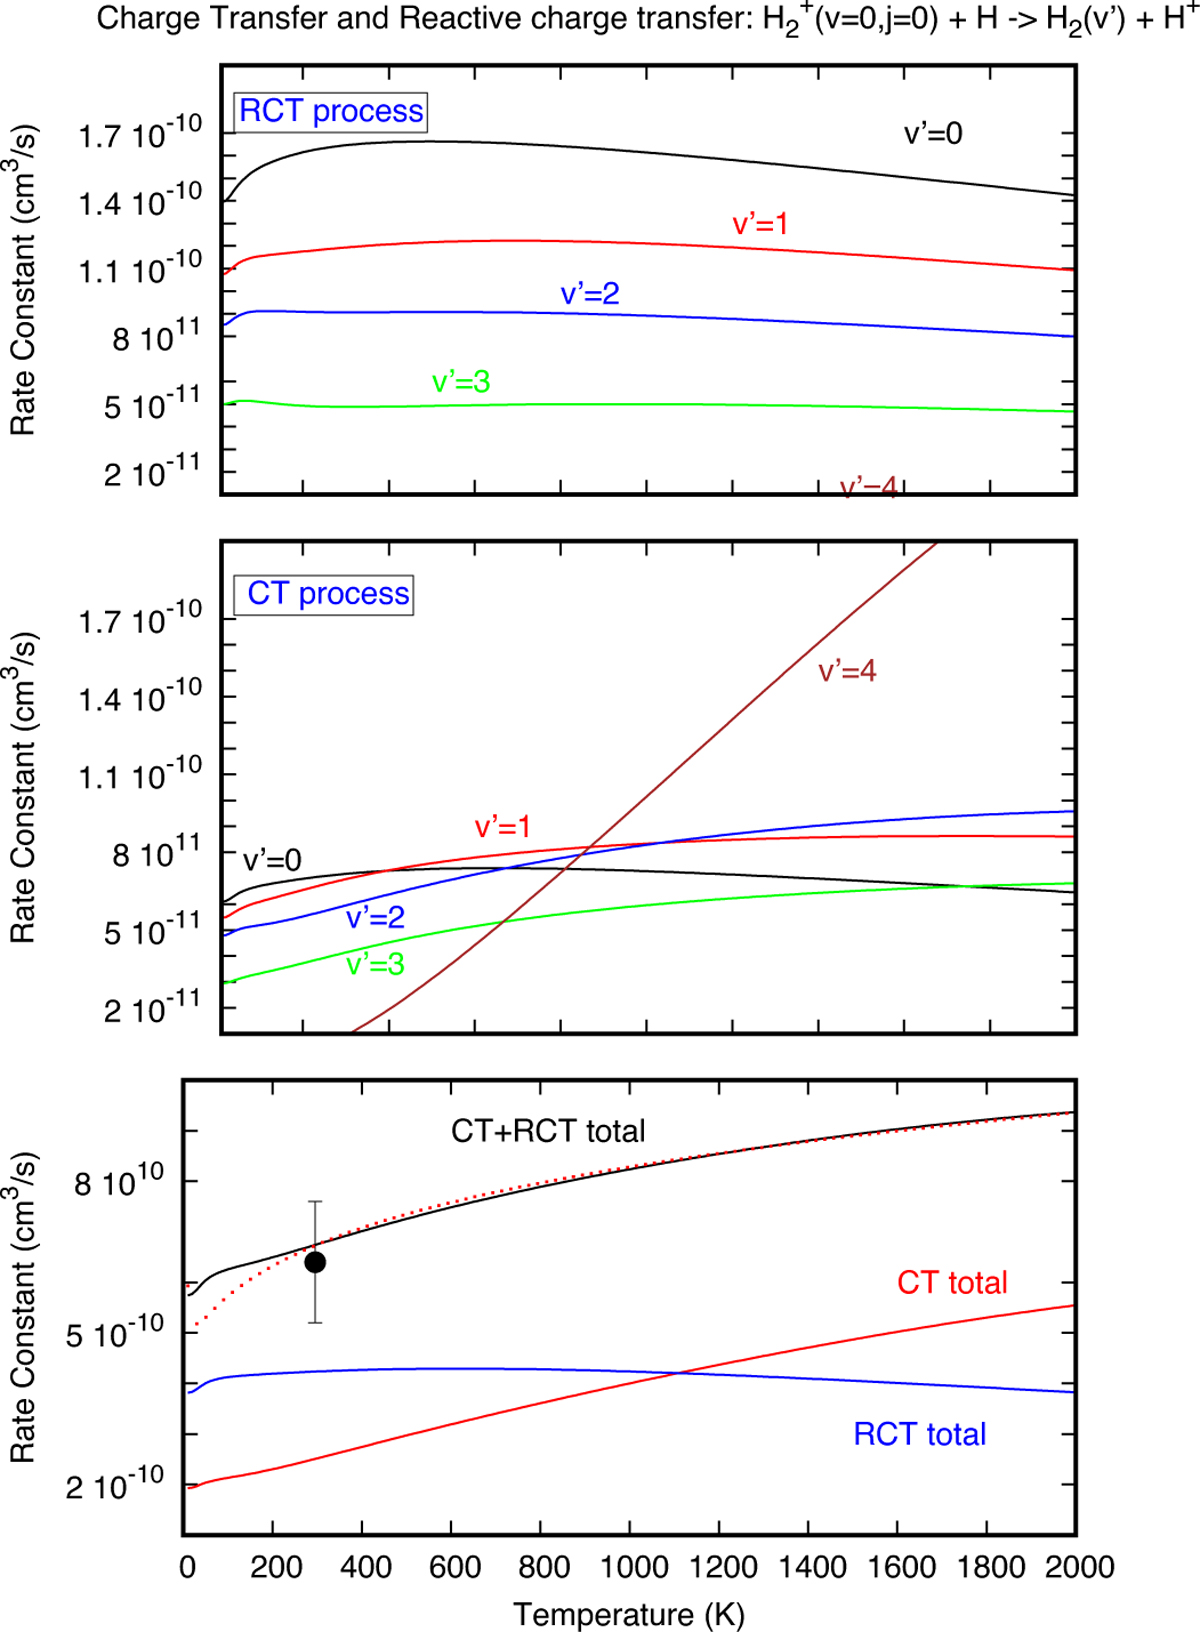
State-dependent rate constants for the reaction ![]() . In the bottom panel, CT, RCT and the total sum are presented. In the middle and top panels, the pure CT and RCT process are shown, respectively, showing the final state distribution of
. In the bottom panel, CT, RCT and the total sum are presented. In the middle and top panels, the pure CT and RCT process are shown, respectively, showing the final state distribution of ![]() vibrational states. The dotted curve represents the Arrhenius fit to the total rate constant. The point in the lower panel corresponds to the experimental measurement by Karpas et al. (1979).
vibrational states. The dotted curve represents the Arrhenius fit to the total rate constant. The point in the lower panel corresponds to the experimental measurement by Karpas et al. (1979).
Current usage metrics show cumulative count of Article Views (full-text article views including HTML views, PDF and ePub downloads, according to the available data) and Abstracts Views on Vision4Press platform.
Data correspond to usage on the plateform after 2015. The current usage metrics is available 48-96 hours after online publication and is updated daily on week days.
Initial download of the metrics may take a while.