Fig. D.1
Download original image
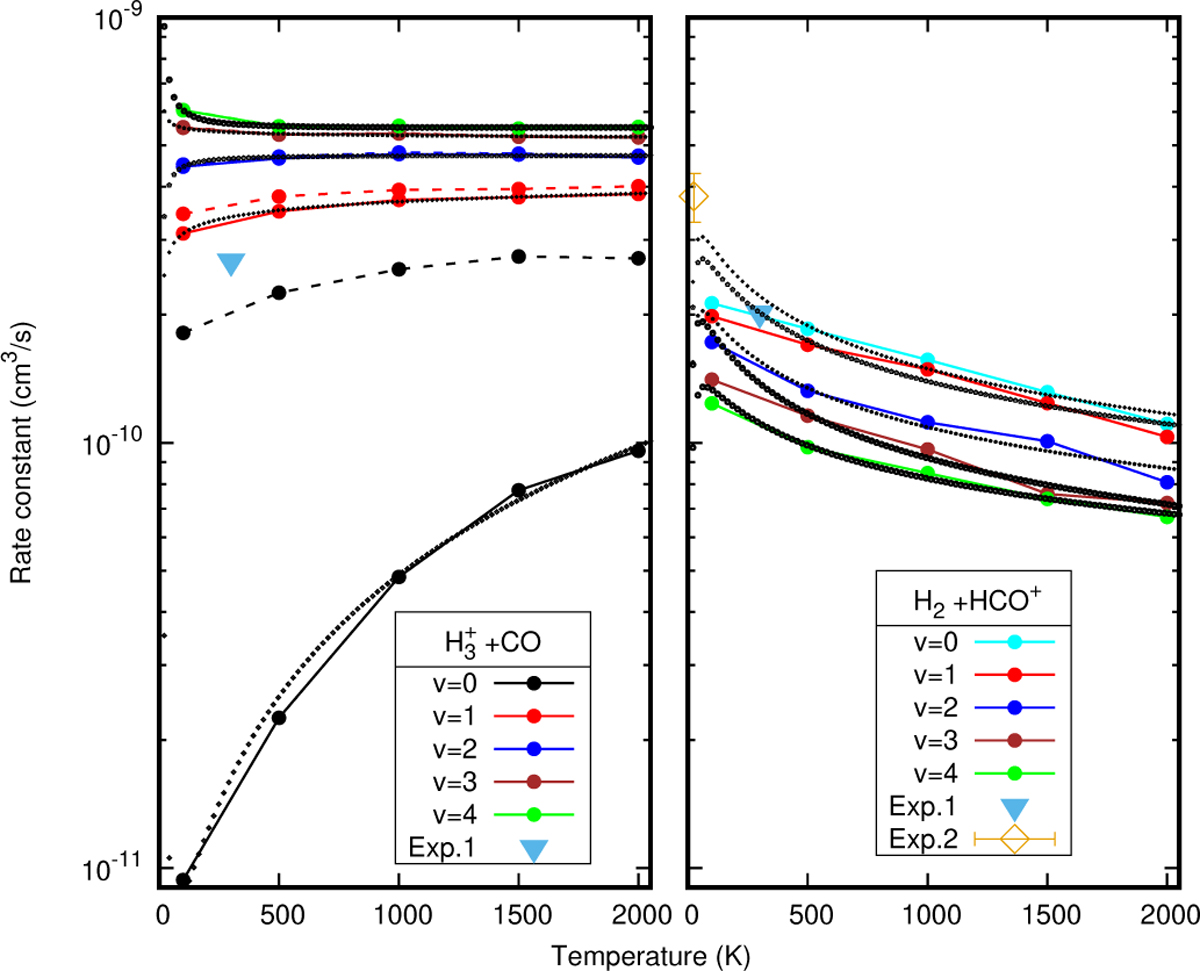
H2(v = 0–4, j = 0) + HOC+, obtained using a QCT method, are shown with and without the ZPE correction for the ![]() ZPE. Solid lines represent the corrected results; dashed lines show the uncorrected ones. Dotted curves represent the Arrhenius fit to the ZPE-corrected rates. The yellow point in the right panel indicates the experimental rate constant reported by Smith et al. (2002), while the blue triangles represent the rate constants reported by Freeman et al. (1987).
ZPE. Solid lines represent the corrected results; dashed lines show the uncorrected ones. Dotted curves represent the Arrhenius fit to the ZPE-corrected rates. The yellow point in the right panel indicates the experimental rate constant reported by Smith et al. (2002), while the blue triangles represent the rate constants reported by Freeman et al. (1987).
Current usage metrics show cumulative count of Article Views (full-text article views including HTML views, PDF and ePub downloads, according to the available data) and Abstracts Views on Vision4Press platform.
Data correspond to usage on the plateform after 2015. The current usage metrics is available 48-96 hours after online publication and is updated daily on week days.
Initial download of the metrics may take a while.