Fig. 6
Download original image
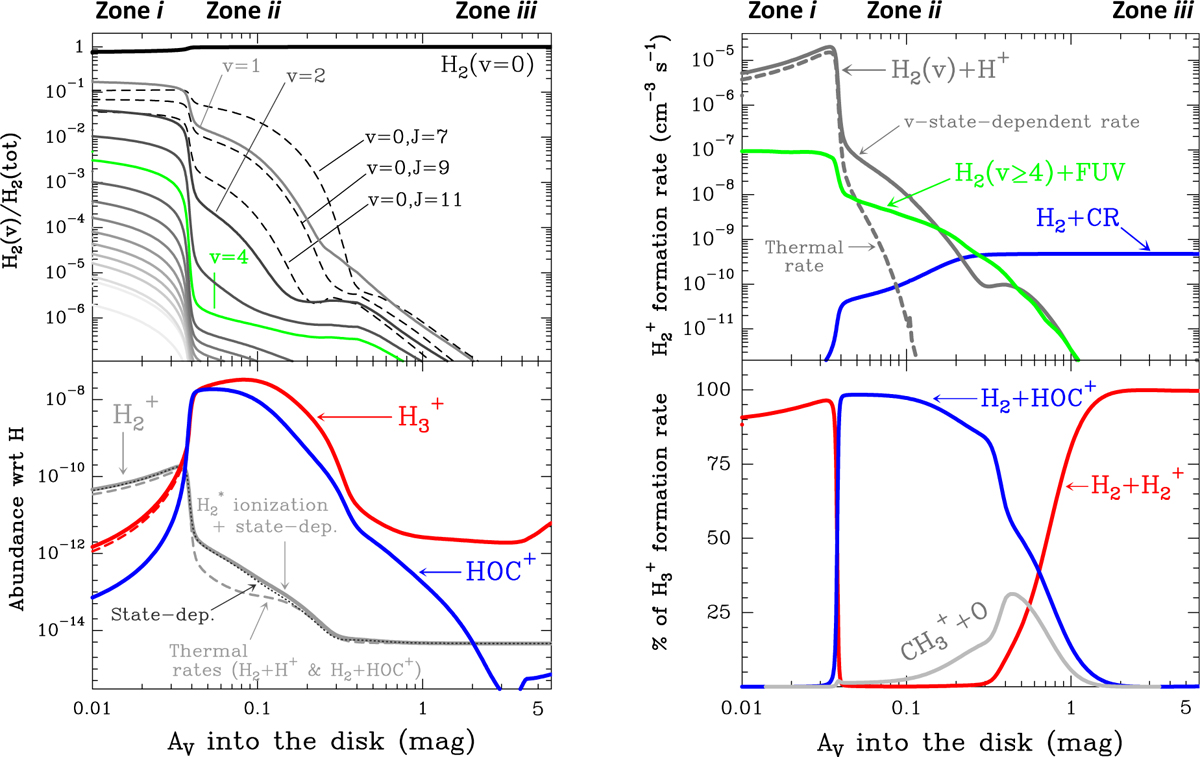
Models of the PDR component in d203-506. Left panels: H2 relative populations and abundances. The upper panel shows the normalized distribution of H2(v) populations across different vibrational levels (solid curves), along with the rotationally excited H2(v = 0, J = 7, 9, 11) levels (dashed curves). The lower panel displays abundance profiles of ![]() ,
, ![]() , and HOC+. Continuous curves show results for models using state-dependent rate constants for reactions (2), (9), (10), and for H2(v≥4) photoionization (the complete reference model). Dotted curves are for models neglecting H2 photoionization. Dashed curves are for models neglecting H2 photoionization and using the thermal rate constants for reactions (2), (9), and (10). Right panels: chemical formation rates.
, and HOC+. Continuous curves show results for models using state-dependent rate constants for reactions (2), (9), (10), and for H2(v≥4) photoionization (the complete reference model). Dotted curves are for models neglecting H2 photoionization. Dashed curves are for models neglecting H2 photoionization and using the thermal rate constants for reactions (2), (9), and (10). Right panels: chemical formation rates. ![]() formation rates as a function of depth into the PDR (upper box). Contribution (in %) to the
formation rates as a function of depth into the PDR (upper box). Contribution (in %) to the ![]() formation rate as a function of depth into the PDR (lower box).
formation rate as a function of depth into the PDR (lower box).
Current usage metrics show cumulative count of Article Views (full-text article views including HTML views, PDF and ePub downloads, according to the available data) and Abstracts Views on Vision4Press platform.
Data correspond to usage on the plateform after 2015. The current usage metrics is available 48-96 hours after online publication and is updated daily on week days.
Initial download of the metrics may take a while.