Fig. 3
Download original image
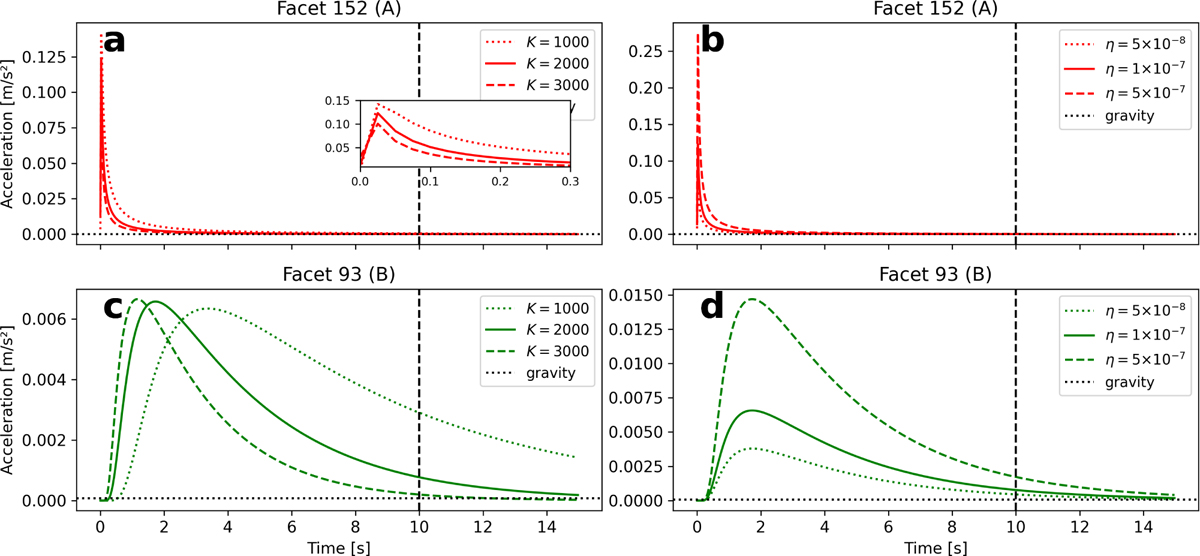
Time-varying acceleration experienced by each facet. (a) Acceleration at facet 152 for different diffusivity values: K = 1000 m2 s−1 (Simulation 2, dotted), K = 2000 m2 s−1 (Simulation 1, solid), and K = 3000 m2 s−1 (Simulation 3, dashed). (b) Acceleration at facet 152 for different seismic efficiency values: η = 5.0 × 10⁻⁸ (Simulation 5, dotted), η = 1.0 × 10⁻⁷ (Simulation 1, solid), and η = 5.0 × 10⁻⁷ (Simulation 8, dashed). (c, d) Same as (a, b), but for facet 93. The horizontal dotted line represents the gravitational acceleration at each facet. The vertical dashed line marks t = 10 seconds, when the simulation ended and exponential decay extrapolation began.
Current usage metrics show cumulative count of Article Views (full-text article views including HTML views, PDF and ePub downloads, according to the available data) and Abstracts Views on Vision4Press platform.
Data correspond to usage on the plateform after 2015. The current usage metrics is available 48-96 hours after online publication and is updated daily on week days.
Initial download of the metrics may take a while.