Fig. 4
Download original image
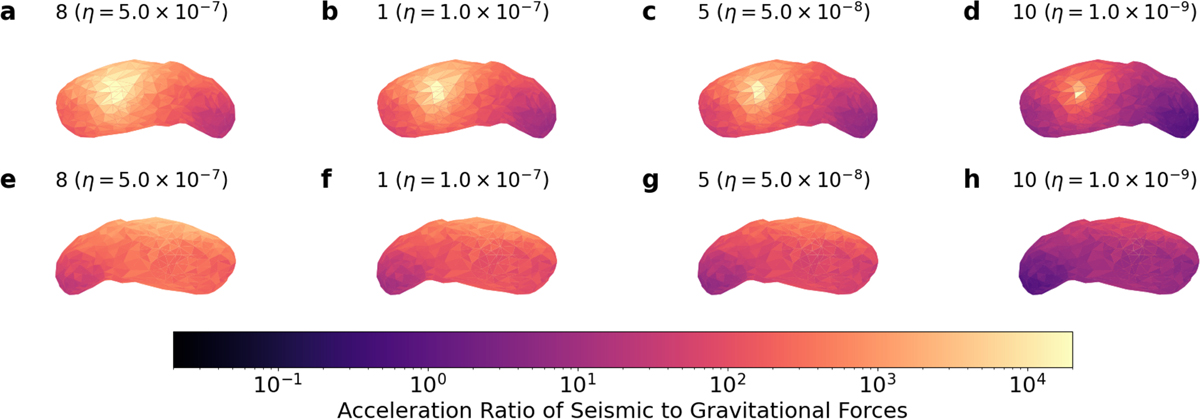
Ratio of the maximum surface acceleration to the local gravitational acceleration on the Kamoi side (western; panels a–d) and the opposite side (eastern; panels e–h) for different η values. All simulations assume a constant K value of 2000. The panels are arranged such that η decreases from left to right. Each column corresponds to an η value of 5 × 10⁻⁷, 1 × 10⁻⁷, 5 × 10⁻⁸, and 1 × 10⁻⁹.
Current usage metrics show cumulative count of Article Views (full-text article views including HTML views, PDF and ePub downloads, according to the available data) and Abstracts Views on Vision4Press platform.
Data correspond to usage on the plateform after 2015. The current usage metrics is available 48-96 hours after online publication and is updated daily on week days.
Initial download of the metrics may take a while.