Fig. 7
Download original image
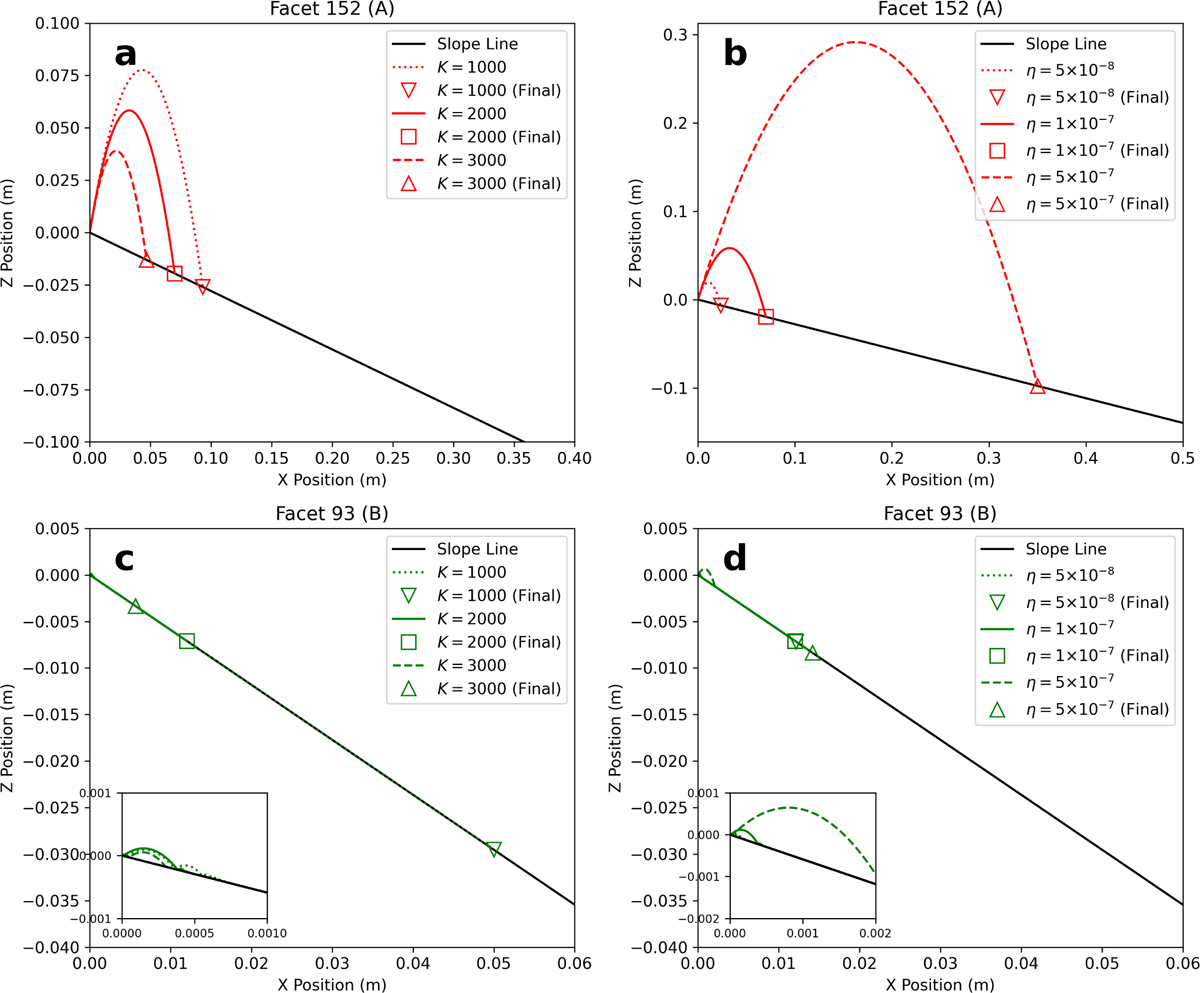
Motion of boulders on each facet. (a) Boulder motion on facet number 152 for different diffusivity values: K = 1000 m2 s−1 (Simulation 2, dotted line with downward triangle), K = 2000 m2 s−1 (Simulation 1, solid line with square), and K = 3000 m2 s−1 (Simulation 3, dashed line with upward triangle). (b) Boulder motion on facet number 152 for different seismic efficiency values: η = 5.0 × 10⁻⁸ (Simulation 5, dotted line with downward triangle), η = 1.0 × 10⁻⁷ (Simulation 1, solid line with square), and η = 5.0 × 10⁻⁷ (Simulation 8, dashed line with upward triangle). (c) and (d) show the same comparisons as (a) and (b), respectively, but for facet 93. The markers indicate the final positions of the boulders 10 minutes after the impact. The inclined black lines represent the local surface slope.
Current usage metrics show cumulative count of Article Views (full-text article views including HTML views, PDF and ePub downloads, according to the available data) and Abstracts Views on Vision4Press platform.
Data correspond to usage on the plateform after 2015. The current usage metrics is available 48-96 hours after online publication and is updated daily on week days.
Initial download of the metrics may take a while.