Fig. 8
Download original image
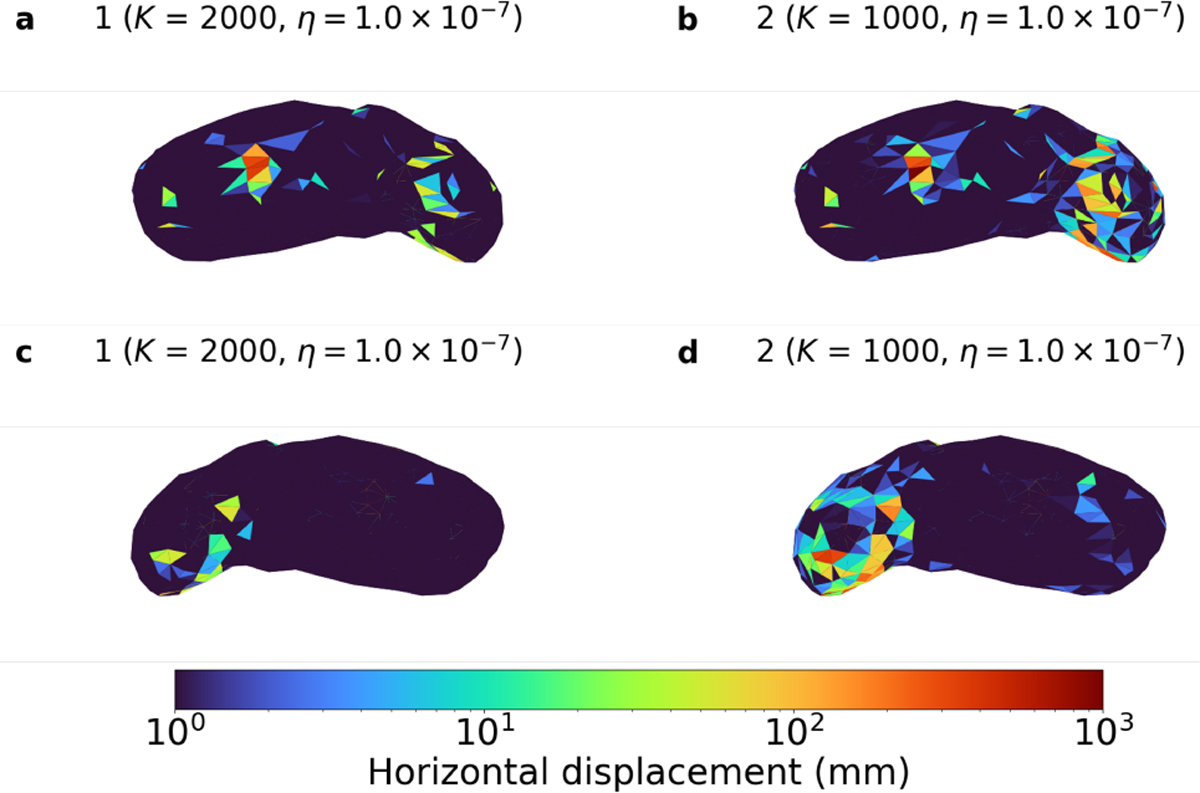
Horizontal displacement of boulders on the western (Kamoi; panels a, b) and eastern (opposite) side (panels c, d). Panels a and c show results from Simulation 1 (η = 1.0 × 10⁻⁷, K = 2000 m2 s−1), and panels b and d show those from Simulation 2 (η = 1.0 × 10⁻⁷, K = 1000 m2 s−1), which reproduces the observed space-weathering distribution on Itokawa best.
Current usage metrics show cumulative count of Article Views (full-text article views including HTML views, PDF and ePub downloads, according to the available data) and Abstracts Views on Vision4Press platform.
Data correspond to usage on the plateform after 2015. The current usage metrics is available 48-96 hours after online publication and is updated daily on week days.
Initial download of the metrics may take a while.