Open Access
Fig. 2.
Download original image
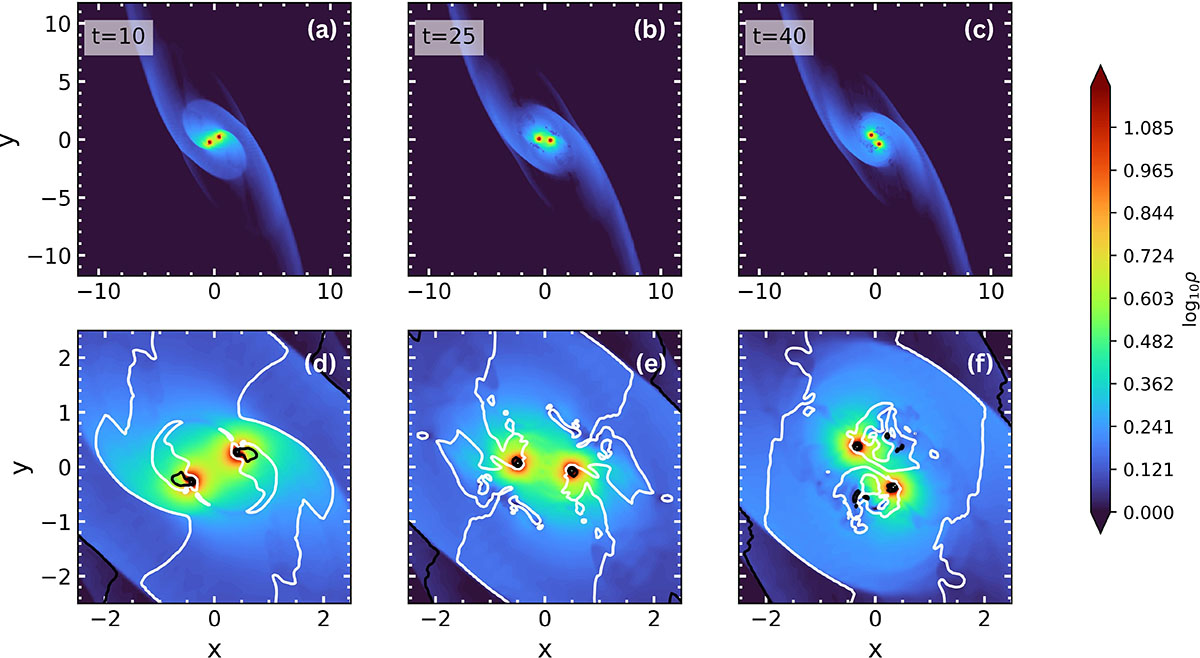
2D slices for the log10ρ at z = 0 plane plotted at different times to show the overall morphology of accretion flow. The bottom panels show the zoomed region near the BBH to highlight the disk structure. The line contours for the sonic Mach number ℳ are also plotted in the bottom panels. The white lines show ℳ = 1.
Current usage metrics show cumulative count of Article Views (full-text article views including HTML views, PDF and ePub downloads, according to the available data) and Abstracts Views on Vision4Press platform.
Data correspond to usage on the plateform after 2015. The current usage metrics is available 48-96 hours after online publication and is updated daily on week days.
Initial download of the metrics may take a while.