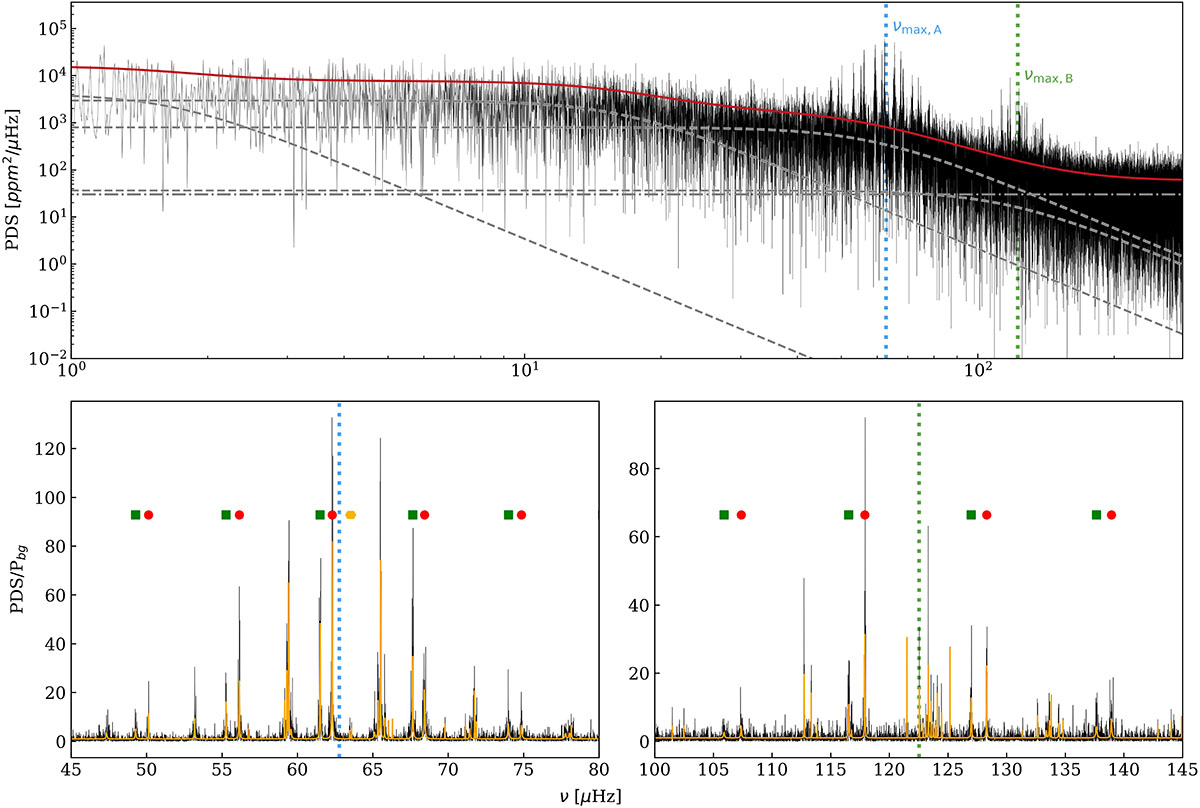
Fig. 2.
Download original image
Power density spectrum and peak-bagging results of KIC 6501237. In the top panel, the dotted blue and green lines indicate νmax, A and νmax, B, respectively. The four granulation components are represented by dashed grey lines, while the white noise is shown as a dash-dotted line. The total background model is depicted as a solid red line. The lower panels show the fitted oscillation modes of both solar-like oscillators in orange. Radial, quadrupole, and octupole modes are marked by red circles, green squares, and yellow hexagons.
Current usage metrics show cumulative count of Article Views (full-text article views including HTML views, PDF and ePub downloads, according to the available data) and Abstracts Views on Vision4Press platform.
Data correspond to usage on the plateform after 2015. The current usage metrics is available 48-96 hours after online publication and is updated daily on week days.
Initial download of the metrics may take a while.