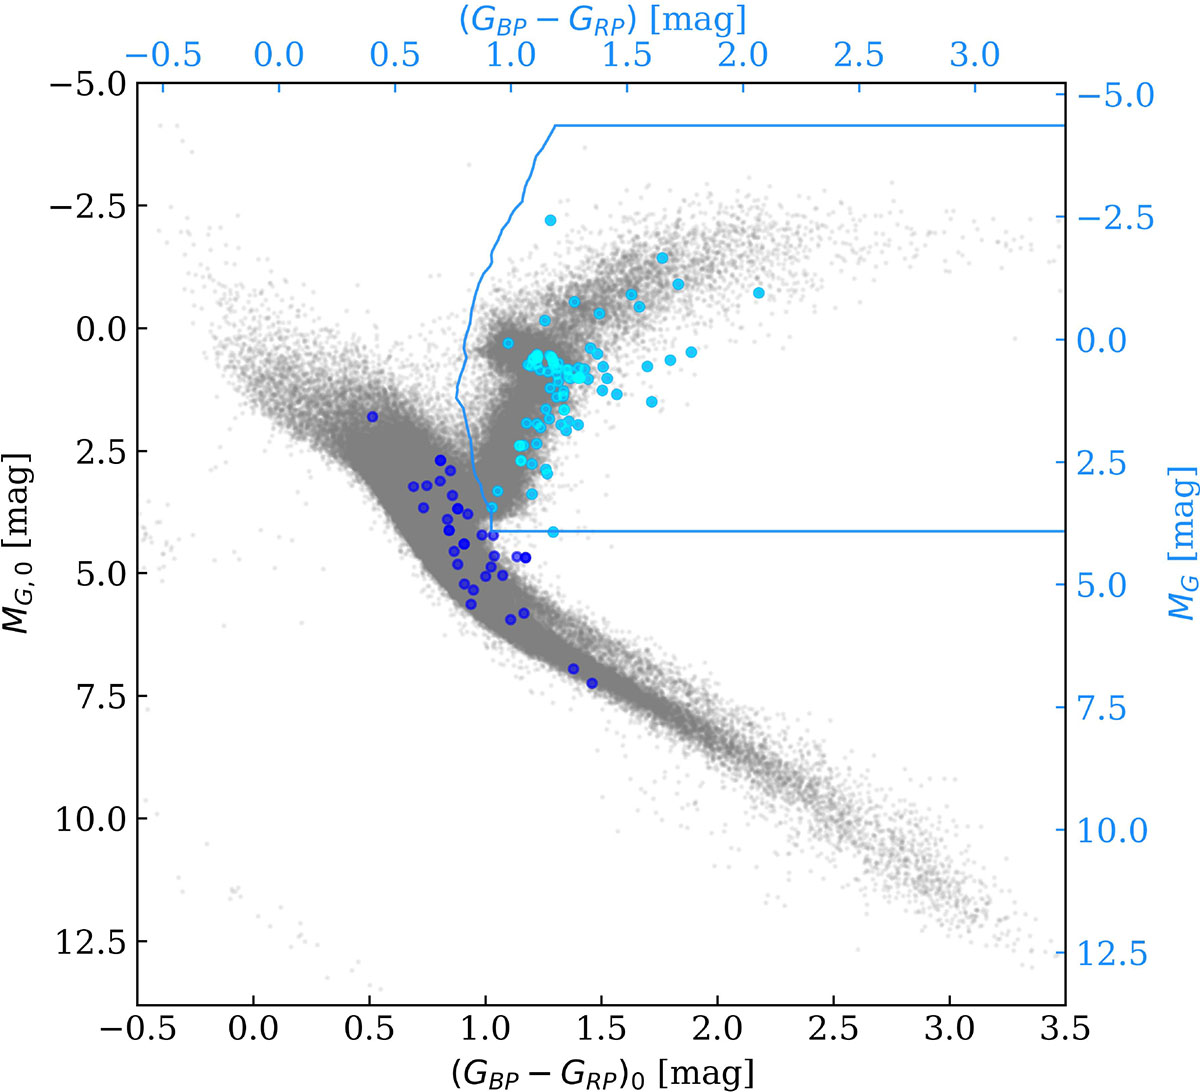
Fig. 3.
Download original image
Gaia colour-magnitude diagram of the AB-member candidates. Grey points represent Kepler stars from Godoy-Rivera et al. (2025), with extinction- and reddening-corrected photometry, plotted using the black axes. The light blue axes are used to plot the Gaia DR3 photometry of our sample that lacks E(BP − RP) and AG corrections. The light blue line depicts the borders of the giant-stars region defined by Godoy-Rivera et al. (2025), adjusted to account for the missing photometric corrections. AB-member candidates classified as giants according to this criterion are shown in cyan, while those excluded by the criteria are shown as blue circles.
Current usage metrics show cumulative count of Article Views (full-text article views including HTML views, PDF and ePub downloads, according to the available data) and Abstracts Views on Vision4Press platform.
Data correspond to usage on the plateform after 2015. The current usage metrics is available 48-96 hours after online publication and is updated daily on week days.
Initial download of the metrics may take a while.