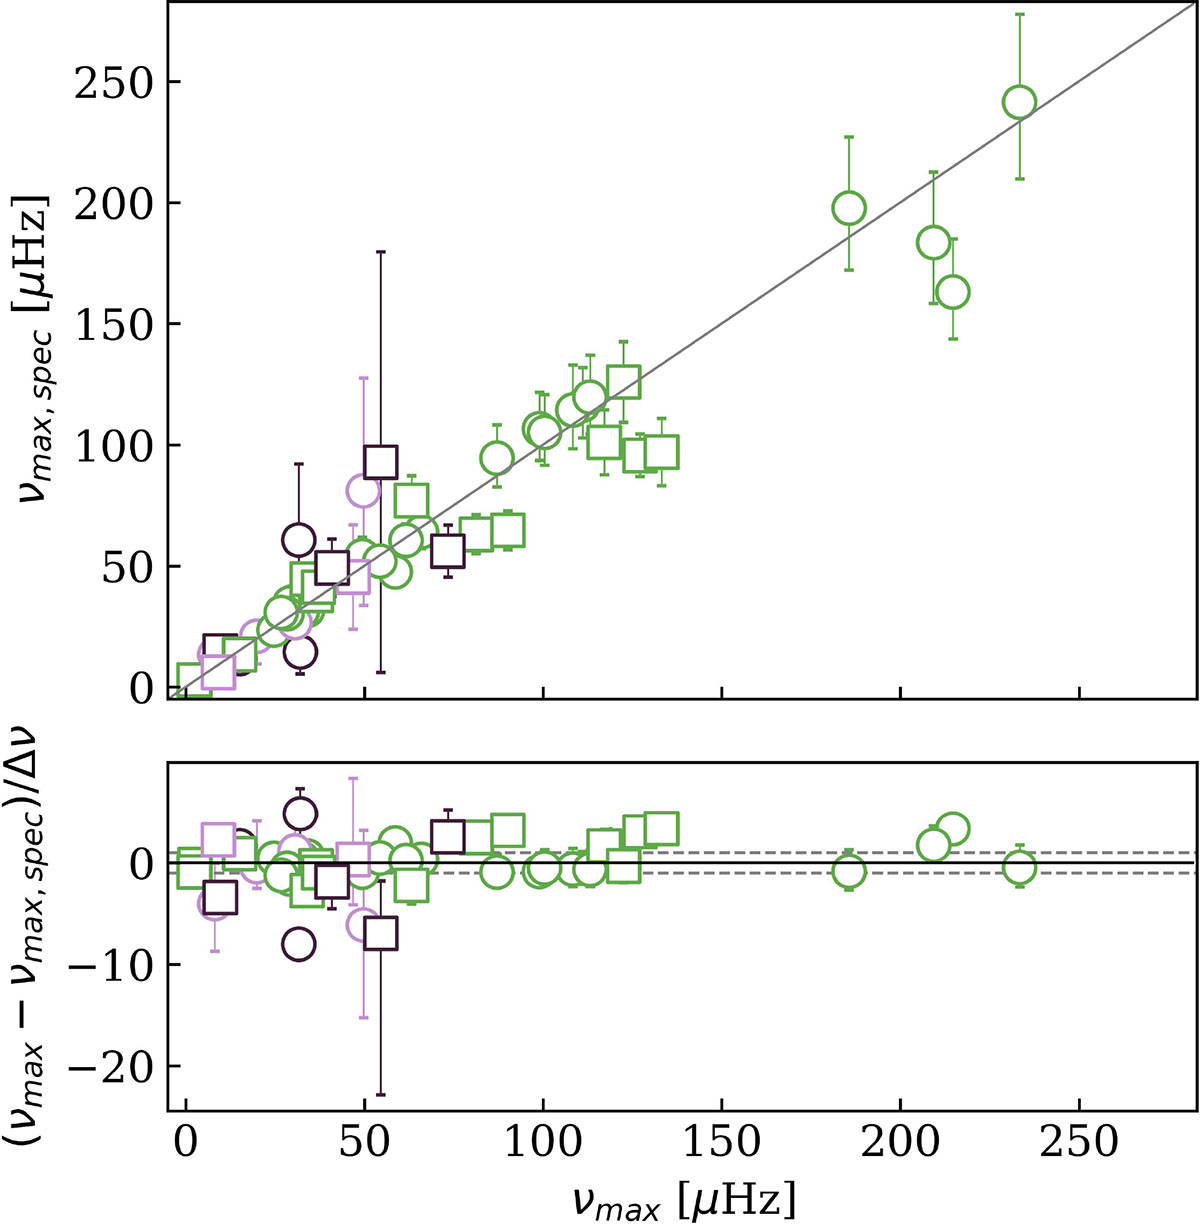
Fig. 4.
Download original image
Comparison of asteroseismic and spectroscopic νmax estimates of the Kepler-Gaia matched sources described in Sect. 4.3. Stars with atmospheric parameters from APOGEE, GSP-Spec, and GSP-Phot are shown in green, purple, and pink, respectively. Circles correspond to ABs where both solar-like oscillators of an AB were matched to a Gaia source. Squares depict ABs where only one of the two oscillators was matched. The bottom panel displays the difference in units of radial order, i.e. normalised by Δν. The dotted grey lines represent differences of ±1Δν.
Current usage metrics show cumulative count of Article Views (full-text article views including HTML views, PDF and ePub downloads, according to the available data) and Abstracts Views on Vision4Press platform.
Data correspond to usage on the plateform after 2015. The current usage metrics is available 48-96 hours after online publication and is updated daily on week days.
Initial download of the metrics may take a while.