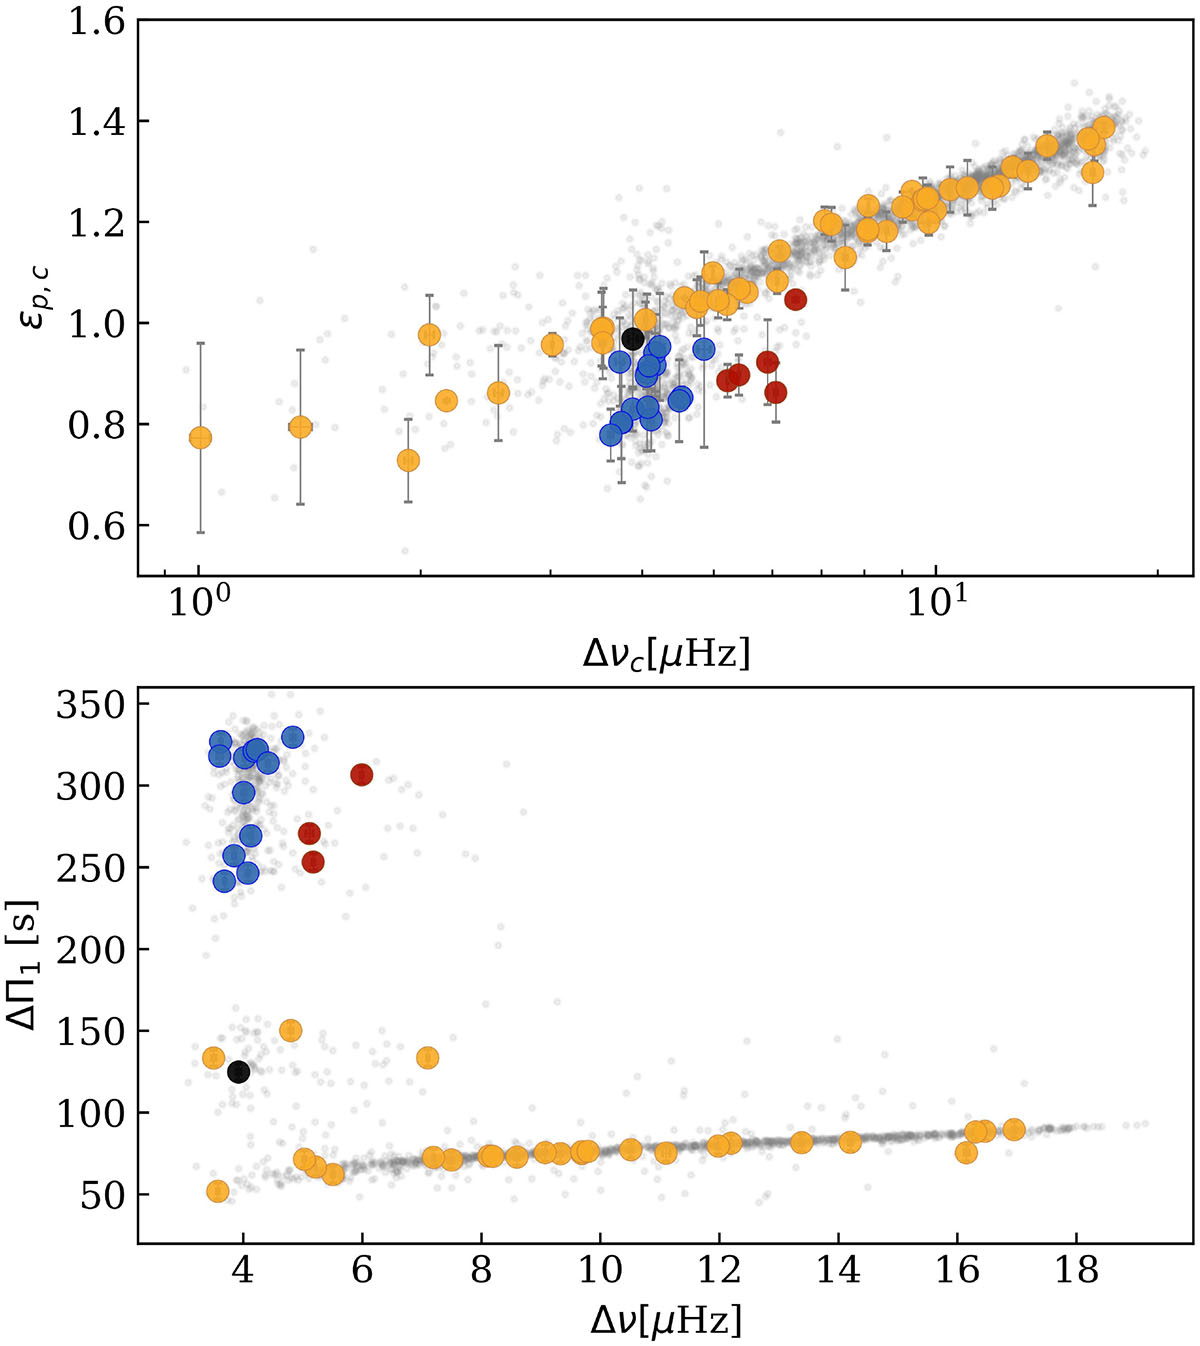
Fig. B.1.
Download original image
Evolutionary stages of our sample. Top: Phase shift of the three central radial modes, ϵc as a function of the central large frequency separation Δνc. Bottom: period spacing ΔΠ1 as a function of Δν. The stars are colour-coded by their evolutionary stage. Orange, blue, and red circles are RGB, red clump (RC), and secondary clump (2CL), respectively. A star with ambiguous evolutionary stage is shown as a black dot. The grey-background circles correspond to the “golden sample” from CAPASS (Espinoza-Rojas et al. in prep).
Current usage metrics show cumulative count of Article Views (full-text article views including HTML views, PDF and ePub downloads, according to the available data) and Abstracts Views on Vision4Press platform.
Data correspond to usage on the plateform after 2015. The current usage metrics is available 48-96 hours after online publication and is updated daily on week days.
Initial download of the metrics may take a while.