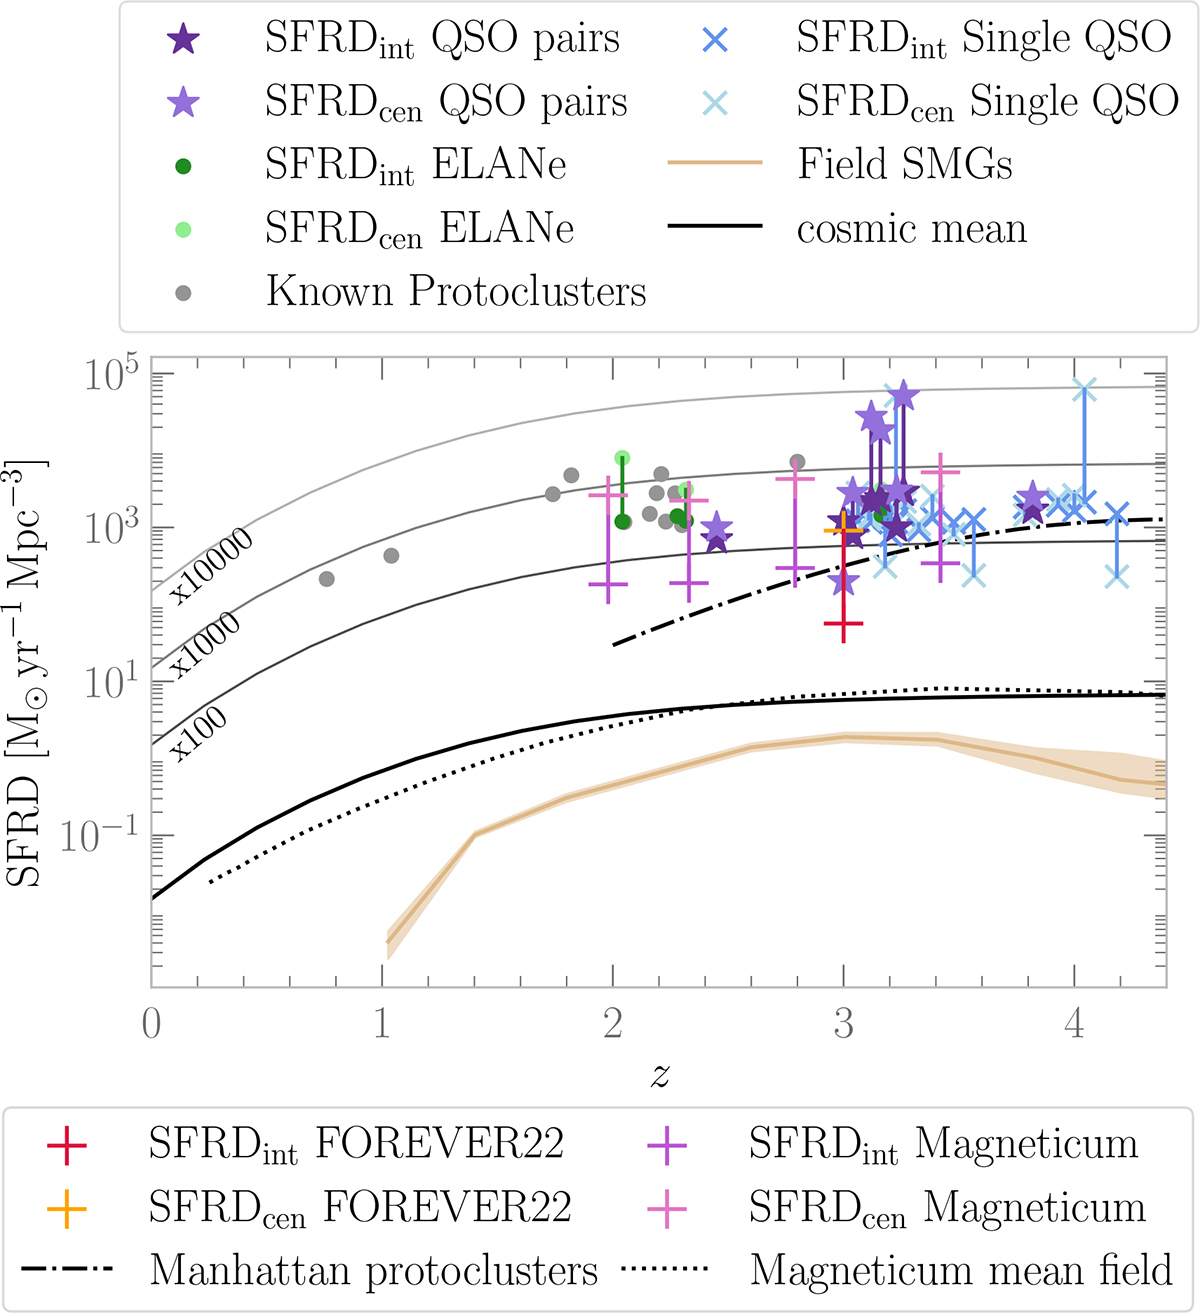
Fig. 7.
Download original image
SFRD in the central 1 Mpc (SFRDcen) and from the source model of the full field (SFRDint) for quasar pairs, ELANe (Nowotka et al. 2022; Arrigoni Battaia et al. 2023), and single quasars (Arrigoni Battaia et al. 2023), compared to values reported for known protoclusters (Clements et al. 2014; Dannerbauer et al. 2014; Kato et al. 2016) and simulation predictions from FOREVER22 (PCR0; Yajima et al. 2022) and Magneticum Box2b (the most massive halo; Remus et al. 2023), both integrated within the central 1 Mpc (SFRDcen) and 3 Mpc (SFRDint). The solid black line shows the mean cosmic SFRD (Madau & Dickinson 2014); the solid gray lines are the mean cosmic SFRD scaled up by a factor of 100, 1000, and 10 000, respectively; the beige line shows the SFRD for blank field SMGs (Dudzevičiūtė et al. 2020); the dash-dotted line shows the simulation prediction for SFRD within protoclusters by Rennehan (2024); and the dotted line is the SFRD in the Magneticum mean field (Dolag et al. 2025).
Current usage metrics show cumulative count of Article Views (full-text article views including HTML views, PDF and ePub downloads, according to the available data) and Abstracts Views on Vision4Press platform.
Data correspond to usage on the plateform after 2015. The current usage metrics is available 48-96 hours after online publication and is updated daily on week days.
Initial download of the metrics may take a while.