Fig. 10
Download original image
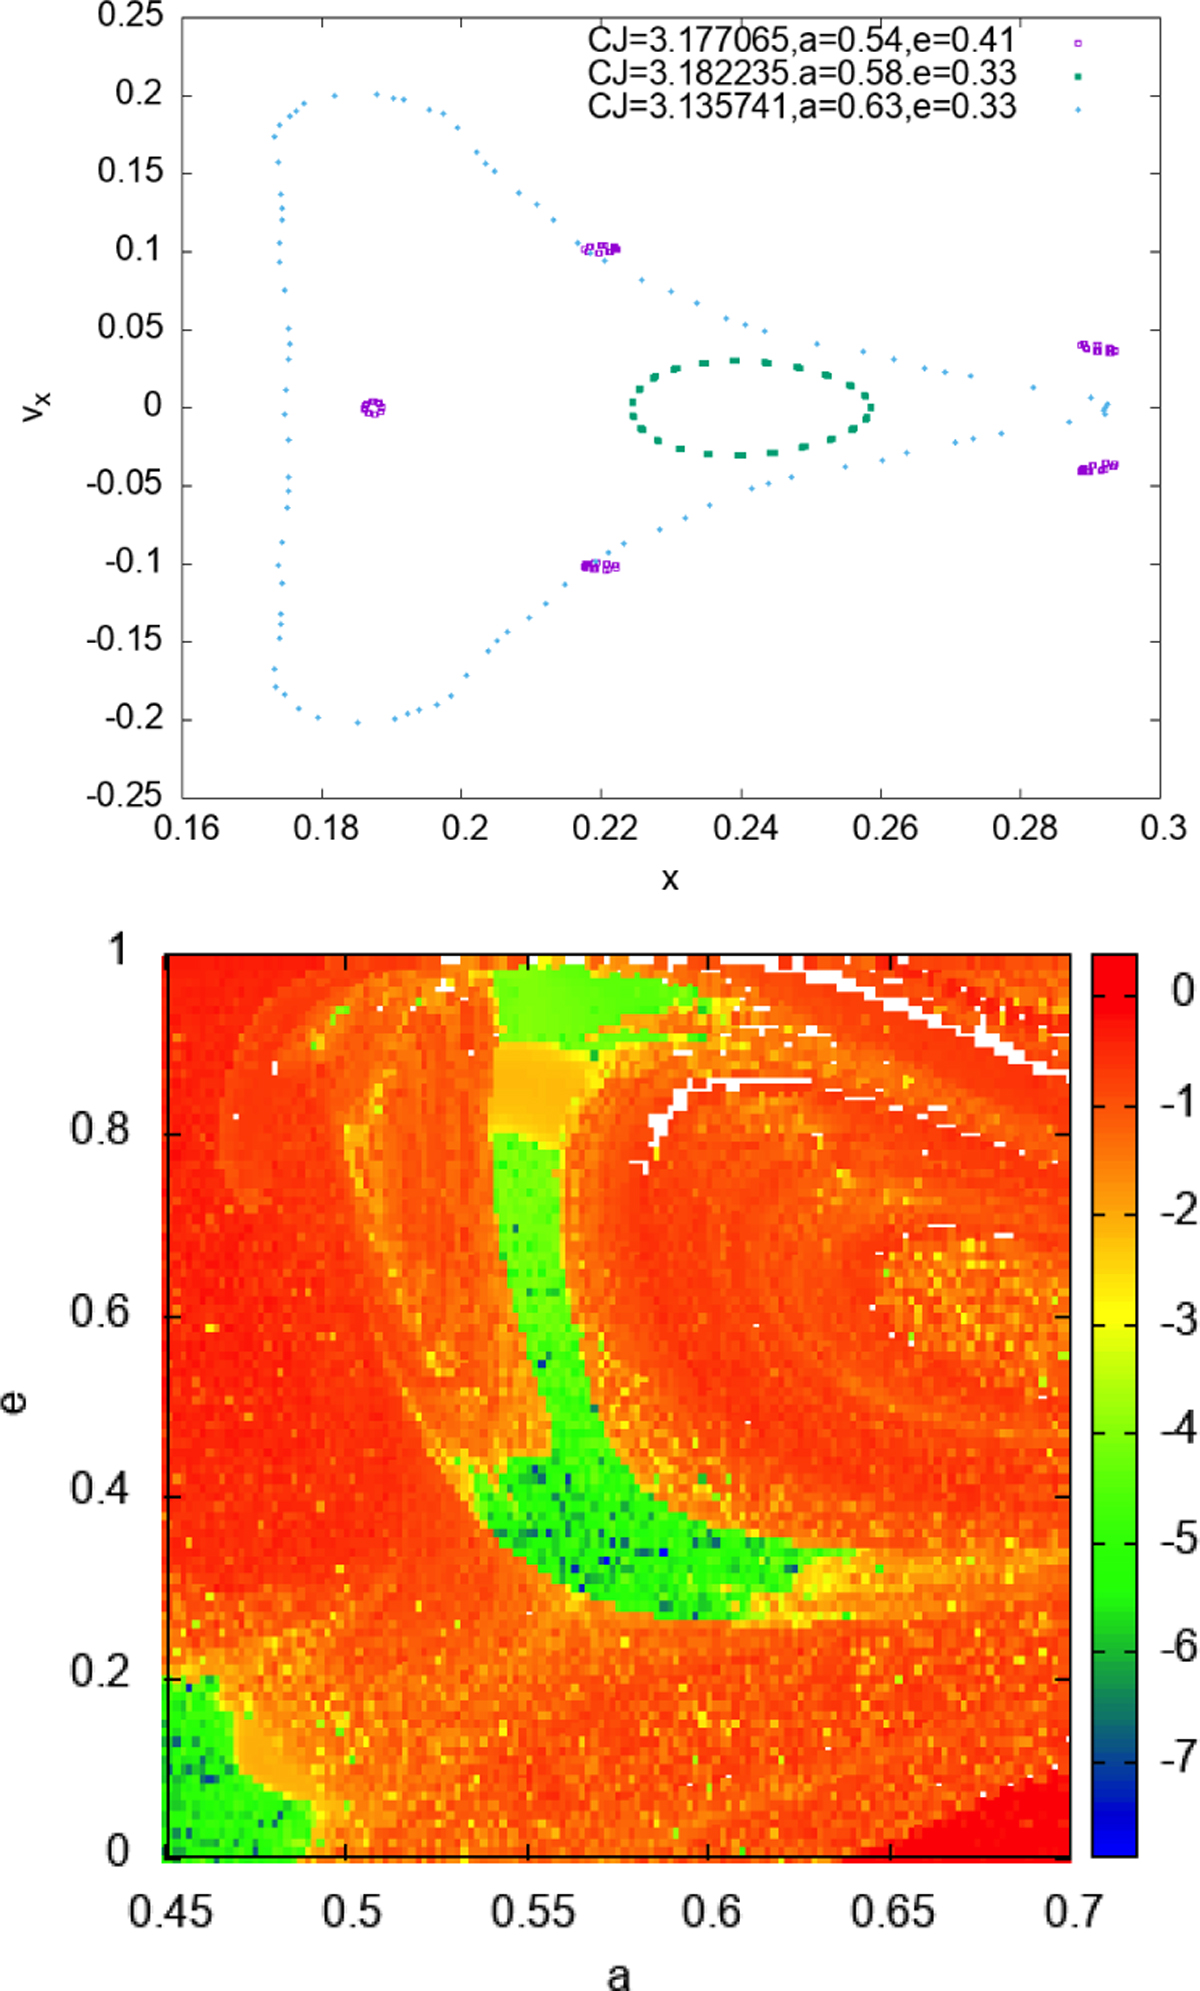
Upper panel: Poincaré surfaces of section in the (x, vx) plane for selected trajectories at the boundaries of the sailboat region with μ = 0.13. Three trajectories correspond to different positions within the sailboat: leftmost edge, center, and rightmost edge. Quasi-periodic orbits appear as closed curves, confirming stability. Bottom panel: map of LCN in the same region for case μ = 0.13. The most negative regions indicate less chaotic trajectories.
Current usage metrics show cumulative count of Article Views (full-text article views including HTML views, PDF and ePub downloads, according to the available data) and Abstracts Views on Vision4Press platform.
Data correspond to usage on the plateform after 2015. The current usage metrics is available 48-96 hours after online publication and is updated daily on week days.
Initial download of the metrics may take a while.