Open Access
Fig. 4
Download original image
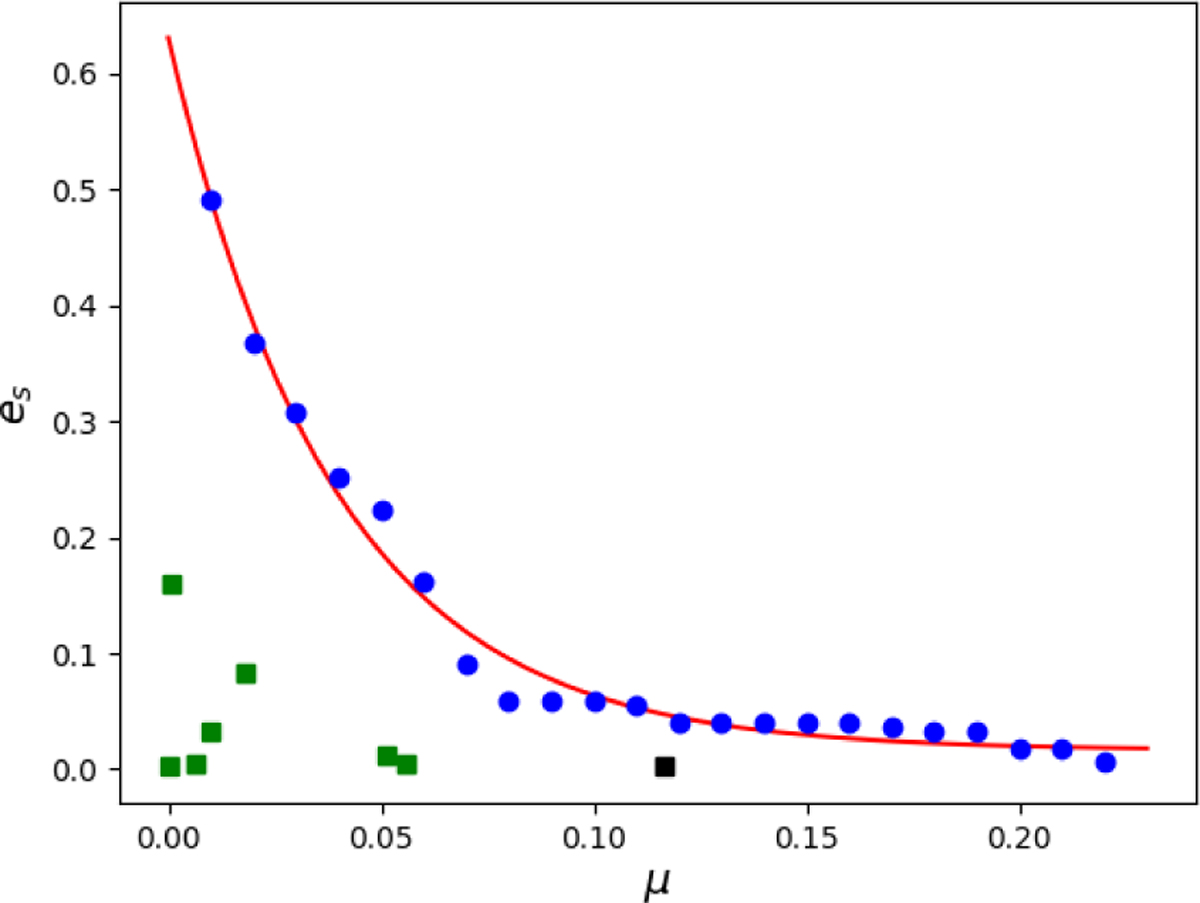
Maximum eccentricity of secondary body (blue dots) versus mass ratio of the system. The red curve represents a fitted model obtained using the least squares method. Green squares denote binary systems of dwarf planets and their satellites, while the black square represents the Pluto–Charon system.
Current usage metrics show cumulative count of Article Views (full-text article views including HTML views, PDF and ePub downloads, according to the available data) and Abstracts Views on Vision4Press platform.
Data correspond to usage on the plateform after 2015. The current usage metrics is available 48-96 hours after online publication and is updated daily on week days.
Initial download of the metrics may take a while.