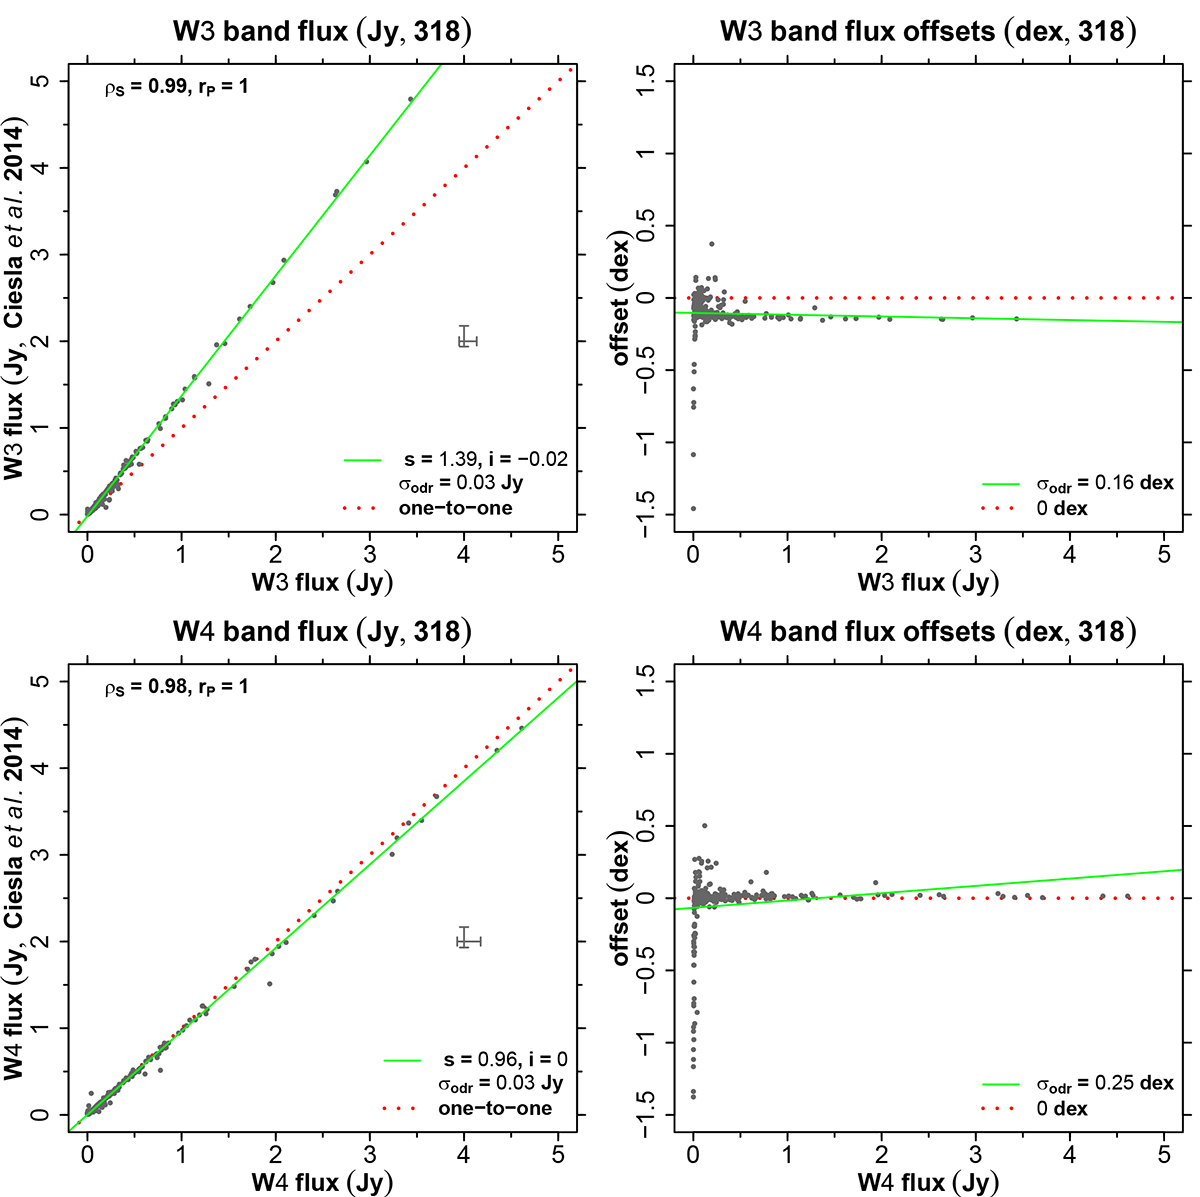
Fig. B.1.
Download original image
Comparison of W3 and W4 band integrated fluxes from Ciesla et al. (2014) and this work for 318 HRS galaxies (top and bottom, respectively, with grey points and green line fits). All fits are derived from orthogonal distance regression. Left column: Spearman and Pearson correlation coefficients (ρS, rP, top), and fit slope and intercept (s, i, bottom). Bars show the typical dispersion (interquartile ranges). Right column: flux offsets with the corresponding dispersion (σodr). Red dotted lines indicate the one-to-one relation and zero offset (left and right).
Current usage metrics show cumulative count of Article Views (full-text article views including HTML views, PDF and ePub downloads, according to the available data) and Abstracts Views on Vision4Press platform.
Data correspond to usage on the plateform after 2015. The current usage metrics is available 48-96 hours after online publication and is updated daily on week days.
Initial download of the metrics may take a while.