Fig. 1.
Download original image
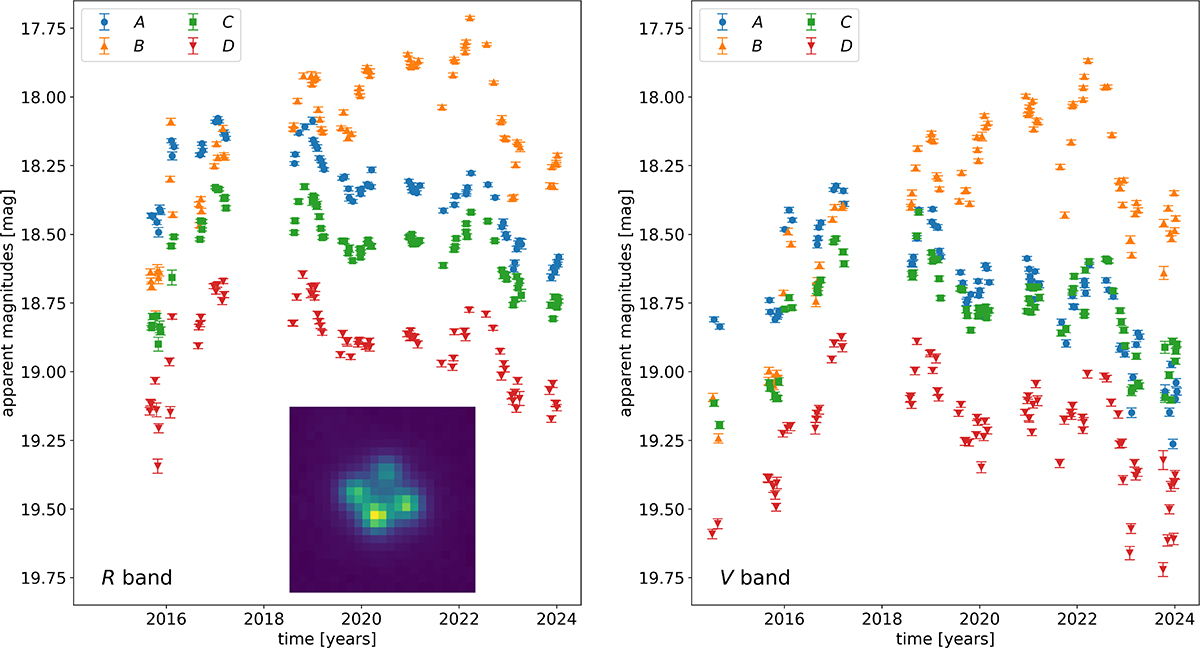
Light curves of HE0435-1223. This figure shows the time-delay-corrected light curves of the four images of HE0435-1223 in the R band (left) and V band (right) with the same time and magnitude ranges, with 1σ magnitude errors. Inside the left panel, we inserted the DIA reference image of HE0435-1223 in the R band (linear in flux) as an example. The image size is 9 arcsec × 9 arcsec. Quasar image A is on the right, and images B, C, and D follow clockwise. Here, image B appears to be the brightest, since the R band reference image is combined mostly from images from the year 2022.
Current usage metrics show cumulative count of Article Views (full-text article views including HTML views, PDF and ePub downloads, according to the available data) and Abstracts Views on Vision4Press platform.
Data correspond to usage on the plateform after 2015. The current usage metrics is available 48-96 hours after online publication and is updated daily on week days.
Initial download of the metrics may take a while.