Fig. 4.
Download original image
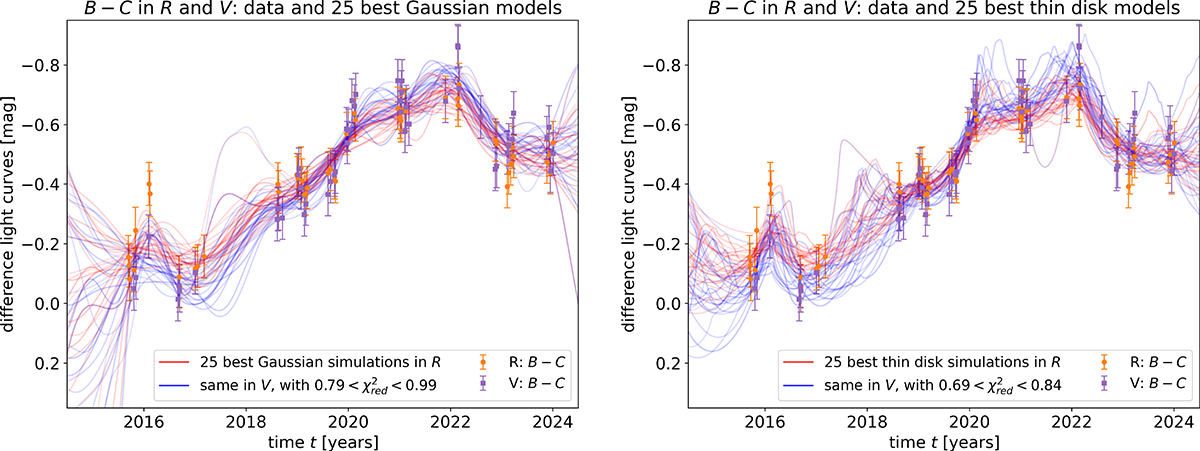
Best-fitting simulated light curves. We show here the best-fitting R and V simulated microlensing light curves (red and blue curves) from the 25 tracks with the smallest χ2 = χR2 + χV2 for the Gaussian disc model (left) and the Shakura-Sunyaev thin disc model (right). The data points are the measured R (orange circles) and V (purple squares) B − C difference curves (i.e. the two uppermost curves on the right side of Fig. 2 inverted and with adapted error bars as described in Sect. 3.2) as used for the χ2 calculation.
Current usage metrics show cumulative count of Article Views (full-text article views including HTML views, PDF and ePub downloads, according to the available data) and Abstracts Views on Vision4Press platform.
Data correspond to usage on the plateform after 2015. The current usage metrics is available 48-96 hours after online publication and is updated daily on week days.
Initial download of the metrics may take a while.