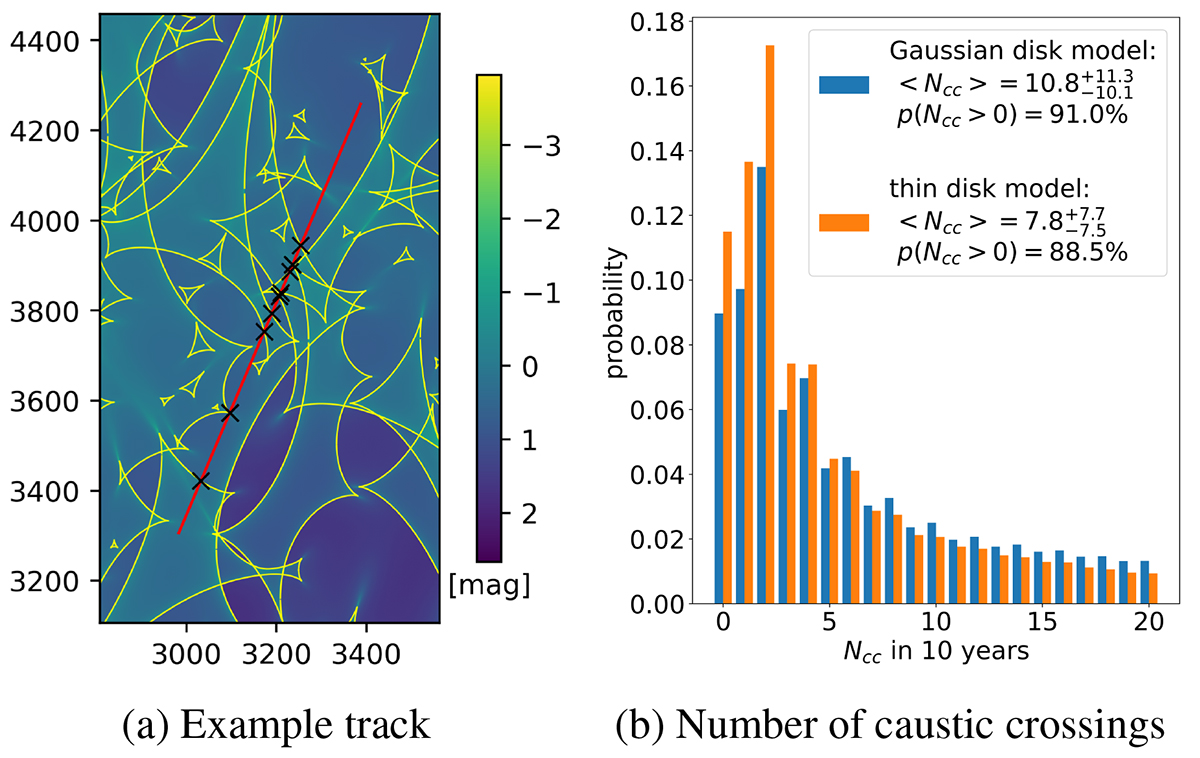
Fig. 7.
Download original image
Number of caustic crossings Ncc. On the left, we show an example track (in red) on the κ⋆/κ = 1.0 map (colour map in magnitudes, x- and y-axis in pixels) crossing 11 (marked with black crosses) caustics (in yellow) over the ten simulated years. On the right, we show the resulting histogram of Ncc (curtailed at Ncc = 20) over all library tracks weighted by their probability.
Current usage metrics show cumulative count of Article Views (full-text article views including HTML views, PDF and ePub downloads, according to the available data) and Abstracts Views on Vision4Press platform.
Data correspond to usage on the plateform after 2015. The current usage metrics is available 48-96 hours after online publication and is updated daily on week days.
Initial download of the metrics may take a while.