Fig. B.2
Download original image
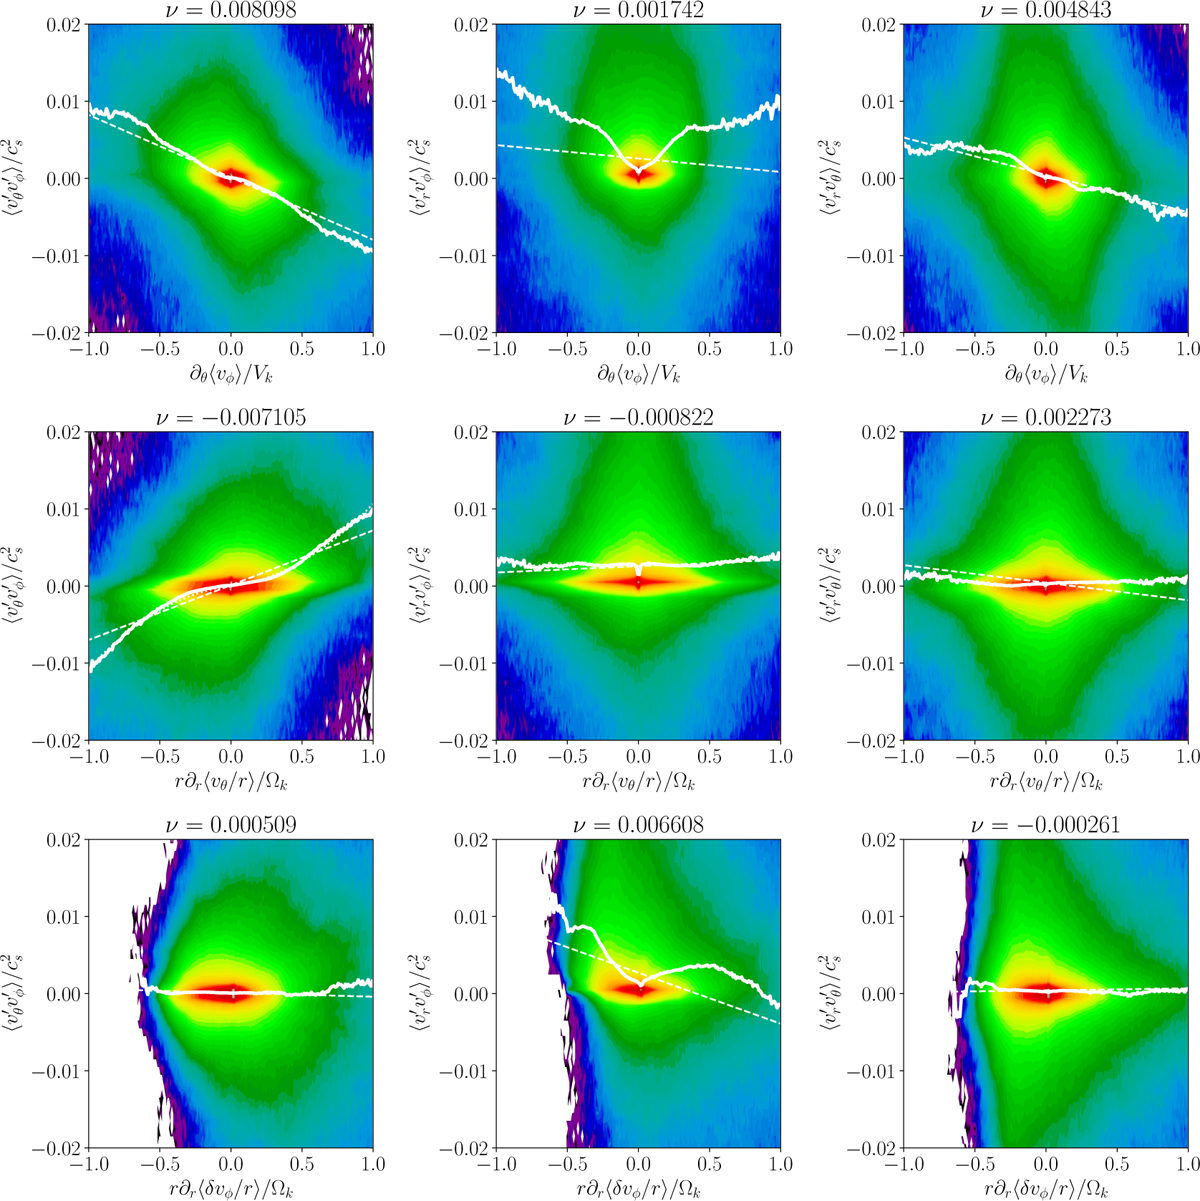
Probability density function (PDF) of the average shear components versus the turbulent stress tensor components. Overplotted in the solid white line is the turbulent stress expectation for a given shear rate, and in dashed line the linear regression of the PDF that yields the corresponding turbulent viscosity (given in the title of each panel).
Current usage metrics show cumulative count of Article Views (full-text article views including HTML views, PDF and ePub downloads, according to the available data) and Abstracts Views on Vision4Press platform.
Data correspond to usage on the plateform after 2015. The current usage metrics is available 48-96 hours after online publication and is updated daily on week days.
Initial download of the metrics may take a while.