Fig. 3.
Download original image
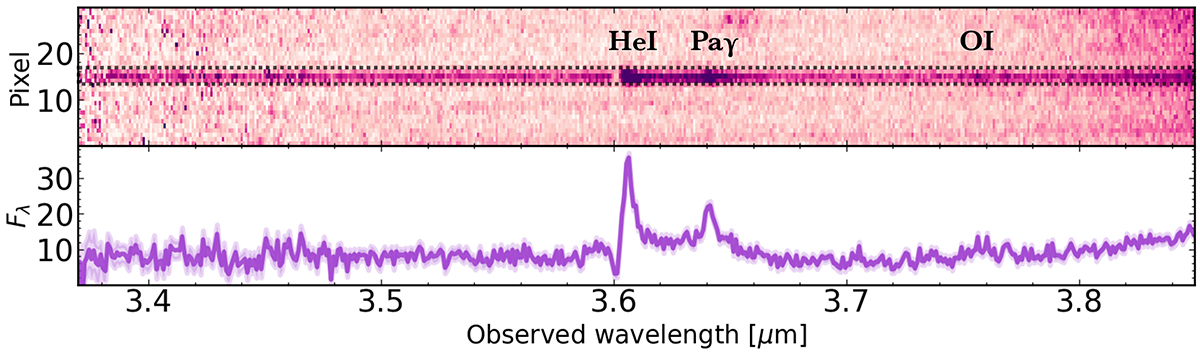
2D and 1D spectrum of BiRD (NIRCam/WFSS). The dotted box indicates the five-pixel aperture used to extract the 1D spectrum. We see clear emission from He I, Paγ, and O I lines, superimposed on the continuum. The contamination from a bright source is visible at the red end of the spectrum. The flux density Fλ is expressed in units of 10−16 erg s−1 cm−2 μm−1. The 1σ error spectrum is reported as a purple shaded area.
Current usage metrics show cumulative count of Article Views (full-text article views including HTML views, PDF and ePub downloads, according to the available data) and Abstracts Views on Vision4Press platform.
Data correspond to usage on the plateform after 2015. The current usage metrics is available 48-96 hours after online publication and is updated daily on week days.
Initial download of the metrics may take a while.