Fig. 4.
Download original image
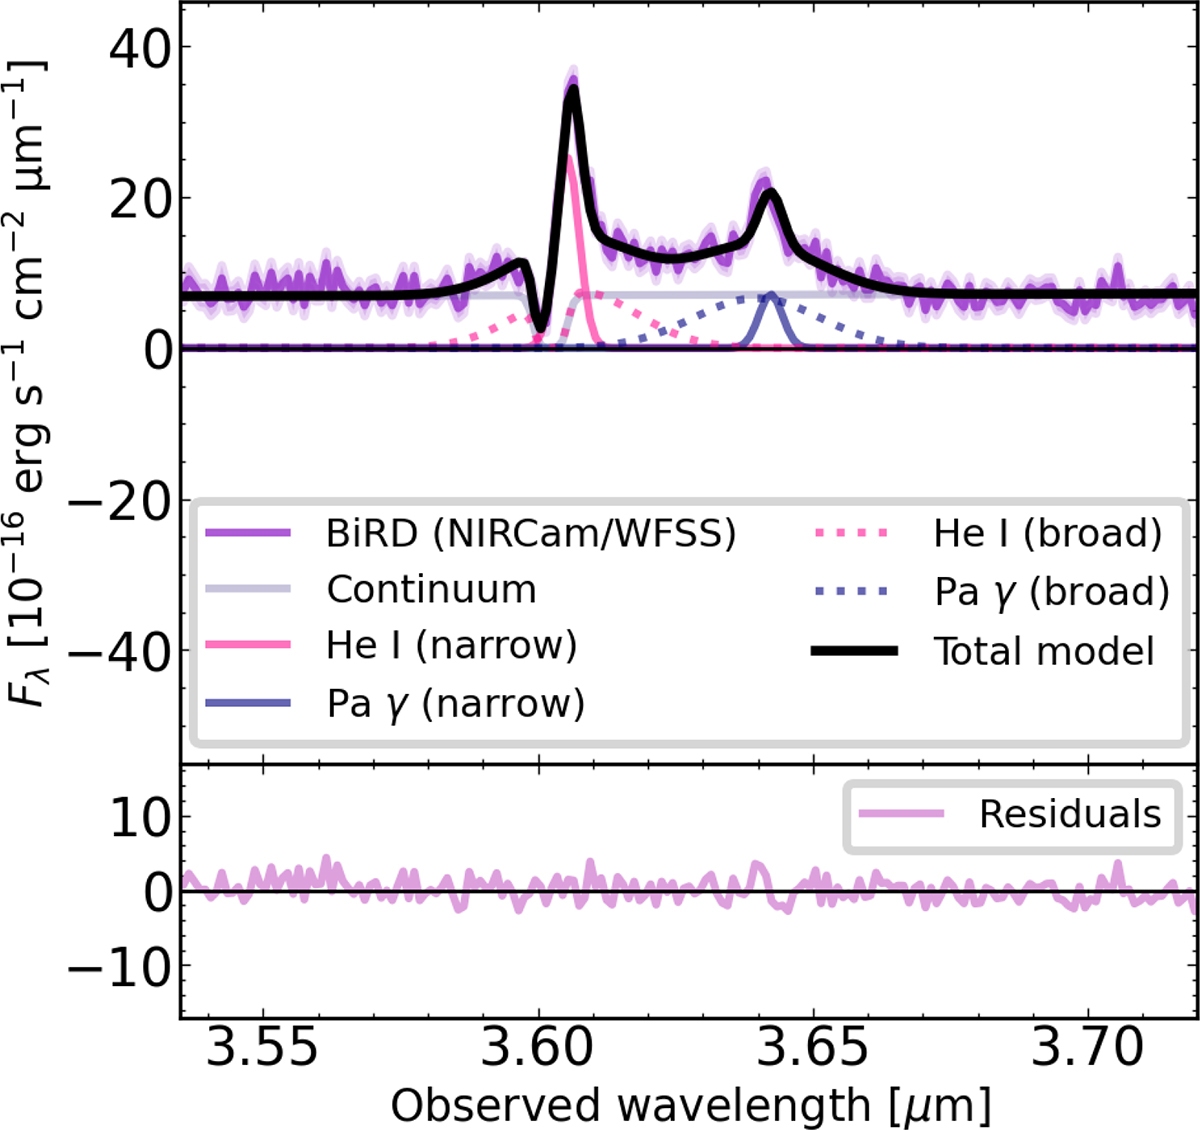
Continuum and line fit of BiRD. The NIRCam/WFSS spectrum is shown in purple with the corresponding errors (shaded area). We modeled both the He I (pink) and the Paγ (violet) emission with a narrow and a broad Gaussian component. An absorption term was applied to both continuum emission and broad He I line to account for the feature at 3.60 μm. We show the fit residuals in the bottom panel (lilac).
Current usage metrics show cumulative count of Article Views (full-text article views including HTML views, PDF and ePub downloads, according to the available data) and Abstracts Views on Vision4Press platform.
Data correspond to usage on the plateform after 2015. The current usage metrics is available 48-96 hours after online publication and is updated daily on week days.
Initial download of the metrics may take a while.