Fig. 2
Download original image
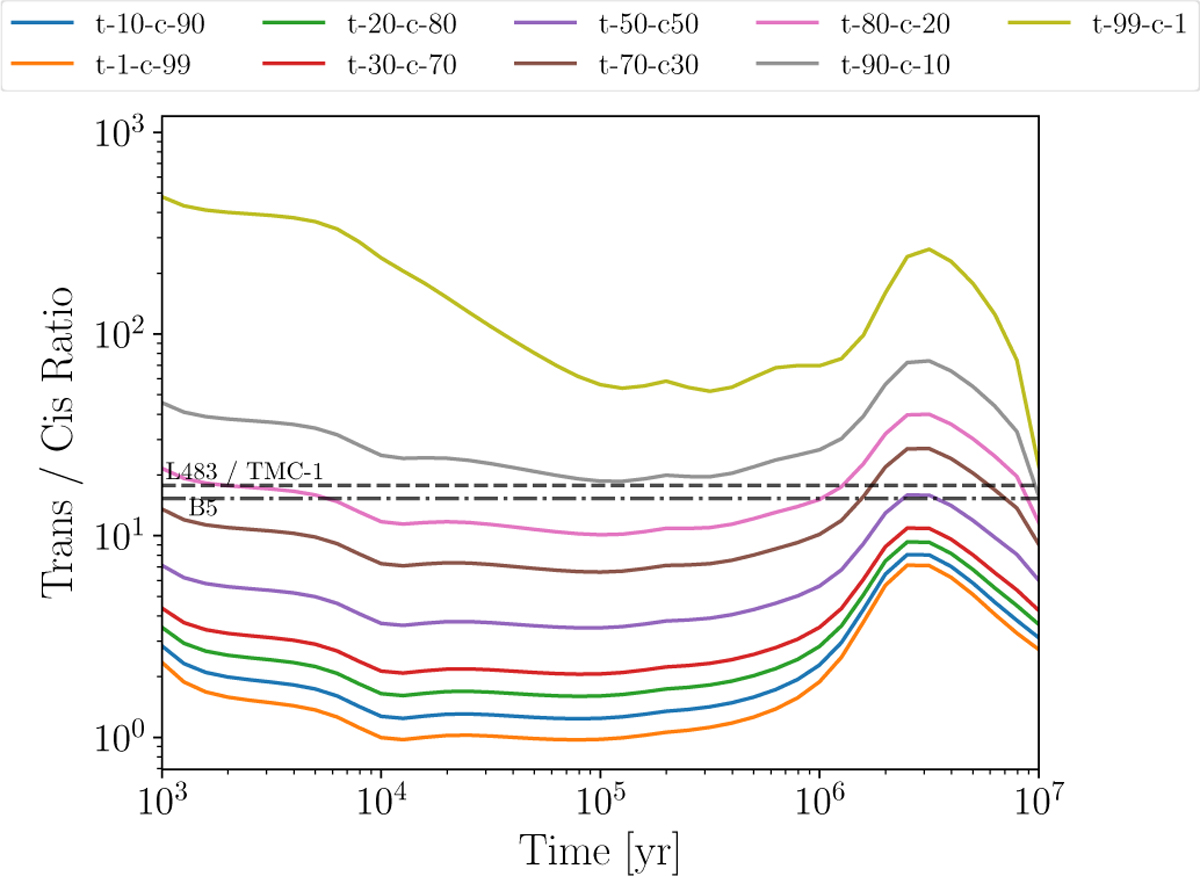
t-FA/c-FA over time as a function of the IUD ratio. In the legend, t and c indicate the isomeric form and the numbers the percentage of desorption of each of them in the t-HOCO + H ⟶ (t/c)–HCOOH reaction. Horizontal lines represent the gas-phase observational abundances of both isomers in the Barnard-5 molecular cloud (Taquet et al. 2017), L483 (Agúndez et al. 2019) and TMC-1 (this work).
Current usage metrics show cumulative count of Article Views (full-text article views including HTML views, PDF and ePub downloads, according to the available data) and Abstracts Views on Vision4Press platform.
Data correspond to usage on the plateform after 2015. The current usage metrics is available 48-96 hours after online publication and is updated daily on week days.
Initial download of the metrics may take a while.