| Issue |
A&A
Volume 703, November 2025
|
|
|---|---|---|
| Article Number | A164 | |
| Number of page(s) | 10 | |
| Section | Interstellar and circumstellar matter | |
| DOI | https://doi.org/10.1051/0004-6361/202555969 | |
| Published online | 13 November 2025 | |
Formic acid isomerism in dark clouds
Detection of cis-formic acid in TMC-1 with the QUIJOTE line survey and astrochemical modeling
1
Departamento de Astrofísica Molecular, Instituto de Física Fundamental (IFF-CSIC),
C/ Serrano 121,
28006
Madrid,
Spain
2
Centro de Astrobiología (CAB), INTA-CSIC,
Carretera de Ajalvir km 4, Torrejón de Ardoz,
28850
Madrid,
Spain
3
Departamento de Ingeniería Química y Química Física, Facultad de Ciencias, and ICCAEx, Universidad Extremadura,
Badajoz,
Spain
★ Corresponding author: This email address is being protected from spambots. You need JavaScript enabled to view it.
Received:
16
June
2025
Accepted:
22
September
2025
Abstract
The presence of molecular isomers in interstellar environments has become a topic of growing interest within the astrochemical community. Contrary to predictions based on thermodynamic equilibrium, recent observations reveal a diverse array of high-energy isomers and conformers. One of the most iconic molecular isomers detected in space, formic acid (HCOOH, FA), has been the focus of extensive theoretical research aimed at understanding its speciation into cis and trans conformers in dark clouds and photodissociation regions. In this work, we report the detection of c-FA, the higher energy conformer, using ultrasensitive observations of TMC-1. This detection builds on previous findings related to the Barnard-5 and L483 dark clouds. The derived trans-to-cis isomer ratio (trans/cis) in TMC-1, 17.5, closely matches those observed in other sources, suggesting that the same chemical processes are at play across these environments. To investigate this, we conducted detailed astrochemical gas-grain models tailored to formic acid isomerism to explain the observed ratios. Our models successfully reproduce the observed trans/cis values and indicate that the presence of cis-formic acid can be attributed to the release of c-FA from grains. This is followed by an isomerization process driven by the excess energy released during desorption, which we have named isomerization-upon-desorption (IUD). The models also show that the isomerization of t-FA to c-FA in the gas phase is negligible at 10 K, meaning the observed ratios are a direct consequence of the formation pathways of both isomers on the surface of dust grains. However, at higher temperatures, quantum tunneling mediated direct isomerization in the gas becomes significant and the ratios converge toward the thermodynamic equilibrium value.
Key words: astrochemistry / methods: numerical / methods: observational / ISM: molecules
© The Authors 2025
 Open Access article, published by EDP Sciences, under the terms of the Creative Commons Attribution License (https://creativecommons.org/licenses/by/4.0), which permits unrestricted use, distribution, and reproduction in any medium, provided the original work is properly cited.
This article is published in open access under the Subscribe to Open model. This email address is being protected from spambots. You need JavaScript enabled to view it. to support open access publication.
1 Introduction
One intriguing aspect of interstellar medium (ISM) chemistry is the observed ratios of isomers detected by radio telescopes1. Unlike on Earth, in the ISM many high-energy isomers (whose energy separation would normally preclude their presence in significant amounts) are found to be abundant (see, e.g., Brünken et al. 2009; Marcelino et al. 2009; Laas et al. 2011; Loomis et al. 2013, 2015; Cuadrado et al. 2016; McGuire et al. 2016; Taquet et al. 2017; Agúndez et al. 2018, 2019, 2023; Rivilla et al. 2019; Cernicharo et al. 2021a, 2022, 2024; Marcelino et al. 2021; Cabezas et al. 2021; Rivilla et al. 2023; San Andrés et al. 2024; Esplugues et al. 2024; Sanz-Novo et al. 2025). These detections challenge the notion that the relative stability of the isomers can be used for abundance prediction, a concept known as the minimum energy principle (Lattelais et al. 2009; Chataigner et al. 2024). Over the years, an increasing body of observational evidence has shown that most interstellar isomers do not adhere to this principle (e.g., Loomis et al. 2015; Shingledecker et al. 2019, 2020; García de la Concepción et al. 2021; Molpeceres et al. 2022; Rivilla et al. 2023; Sanz-Novo et al. 2025). The reason for this discrepancy is clear: in the ISM, the extremely low temperatures (10 K) impose strict kinetic control over the formation and destruction of molecules, including isomers. Unfortunately, understanding the kinetics of these processes requires explicit knowledge of a vast number of chemical reactions and their associated rate coefficients on gas and on the surface of dust grains (some non-exhaustive examples include Laas et al. 2011; Vazart et al. 2015; Shingledecker et al. 2019, 2020; Ishibashi et al. 2021; Ballotta et al. 2021; Molpeceres et al. 2022; García de la Concepción et al. 2023). Since these reactions vary for each molecule and type of isomer, a detailed study of each case is necessary in many cases.
Formic acid (HCOOH, FA) is one of the molecules for which our understanding of molecular isomerism in the ISM is most advanced. This molecule presents two different conformational isomers, commonly labeled cis (c-FA) and trans (t-FA). The more stable of the two is t-FA, with a trans-cis gap of approximately 2050 K (García de la Concepción et al. 2022). It is worth remarking that if molecules followed thermodynamic ratios, the abundance of c-FA would be negligible, precluding detection. Formic acid was one of the first interstellar molecules to be detected (Zuckerman et al. 1971), initially in Sgr B2 in its trans form. Surprisingly, the first detection of the cis isomer occurred much more recently (Cuadrado et al. 2016) at the Orion Bar photodissociation region (PDR). In their study, Cuadrado et al. (2016) explained the presence of c-FA through a photoswitching mechanism, in which isomer-selective UV pumping allows for trans-to-cis interconversion, reaching a pseudo-equilibrium with a trans-to-cis ratio (trans/cis) of ~3. The detection of c-FA in dark clouds occurred later, first in Barnard-5 (Taquet et al. 2017), then in L483 (Agúndez et al. 2019), with this work presenting the third detection, in TMC-1. Several other searches could only provide upper limits, apart from a tentative detection reported by Sanz-Novo et al. (2023) in the G+0.693-0.027 molecular cloud. The detection of c-FA in dark clouds poses a significant riddle, as photoswitching cannot be invoked as the driving force for the isomerism due to the attenuated interstellar radiation field. This is also evident from the observed t-FA/c-FA of nearly 20 in dark clouds.
The presence of c-FA in the cold ISM has provided an excellent framework for postulating and evaluating isomerization mechanisms in interstellar environments. Over the years, various physical and chemical processes have been investigated to rationalize the c-FA abundances in dark clouds. These include tunneling-mediated isomerization (García de la Concepción et al. 2022), gas-phase acid-base reactions (García de la Concepción et al. 2023), and isomer conversion through hydrogenation reactions on grains (Molpeceres et al. 2022). Furthermore, recent studies have shown that FA, regardless of its isomeric form, is primarily formed on the surface of icy dust grains via the formation of the HOCO radical through the CO + OH ⟶ HOCO reaction ((Molpeceres et al. 2023; Ishibashi et al. 2024)), where the isomerism of HOCO also plays a crucial role in determining the final isomeric form of FA (Molpeceres et al. 2025). It is therefore evident that understanding the isomeric excess of a molecule as simple as FA remains a complex challenge, requiring a comprehensive understanding of both its formation and destruction pathways.
In this work, we report the first detection of c-FA in TMC-1 using the QUIJOTE line survey and determine the corresponding trans/cis. Encouraged by the consistent ratios found across the three dark clouds where the molecule has been detected, we undertook the task of fully rationalizing the isomeric chemistry of FA in dark clouds. The similarity in ratios strongly suggests a common underlying chemistry. Following this reasoning, we used astrochemical models to provide a conclusive explanation not only for the specific abundance of c-FA in dark clouds, but also to explain the lack of definitive detections in other regions.
2 Observations
2.1 Description of the observations
We used the latest data set of the Q-band Ultrasensitive Inspection Journey to the Obscure TMC-1 Environment line survey; (QUIJOTE; Cernicharo et al. 2021b) to search for c-FA in TMC-1. In brief, QUIJOTE is an ongoing line survey carried out with the Yebes 40m telescope toward the cyanopolyyne peak position of the cold dense cloud TMC-1 (αJ2000 = 04h 41m 41.9s, δJ2000 = +25° 41′ 27.0″). The observations were carried out using the frequency-switching technique and the data cover the Q band in the frequency range 31.0–50.3 GHz with a spectral resolution of 38.15 kHz. The latest data, already presented in Cabezas et al. (2025) and Agúndez et al. (2025), include observations carried out from November 2019 to July 2024, and amount for 1509.2 h of on-source telescope time (Cernicharo et al. 2024). The ![Mathematical equation: $\[T_{A}^{*}\]$](/articles/aa/full_html/2025/11/aa55969-25/aa55969-25-eq1.png) rms noise level varies between 0.06 mK at 32 GHz and 0.18 mK at 49.5 GHz.
rms noise level varies between 0.06 mK at 32 GHz and 0.18 mK at 49.5 GHz.
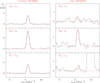 |
Fig. 1 Lines of t-FA and c-FA (left and right panels, respectively) observed in TMC-1. Blanked channels correspond to negative artifacts resulting from the frequency-switching technique. The red lines correspond to the computed line profiles adopting the parameters given in Sect. 2. The lines in top and bottom panels of c-FA have only been marginally detected (See text). |
2.2 Observational results
An inspection of the QUIJOTE data reveals a clean and clear emission line that can be assigned to the 20,2–10,1 rotational transition of c-FA (see middle-right panel in Fig. 1). This is the brightest expected emission line in the Q band at the low gas temperature of TMC-1. We also searched for the lines of t-FA and found three emission lines that could be unambiguously assigned to the 21,2–11,1, 20,2–10,1, and 21,1–11,0 rotational transitions of t-FA (see left panels in Fig. 1). Assuming that the emission of t-FA is distributed as a circle with a radius of 40″, as in the case of other molecules whose emission has been mapped in TMC-1 (Cernicharo et al. 2023), a rotation diagram constructed with the three lines of t-FA observed (see line parameters in Table 1) in the Q band yields a rotational temperature of 7.0 ± 1.0 K (shown in Appendix A). The column density derived for t-FA is (9.3 ± 0.5) × 1011 cm−2, assuming local thermodynamic equilibrium (LTE) at this rotational temperature. We noticed that for t-FA, the 21,1–11,0 and 21,2–11,1 lines are twice less intense than the 20,2–10,1 line; whereas in the case of c-FA, these two lines are considerably weaker with respect to the 20,2–10,1 line (see bottom and top right panels in Fig. 1). In fact, these lines are only marginally detected. The different relative line intensities observed for t-FA and c-FA indicate a distinct excitation probably attributed to the marked difference in the b-type dipole moment: 0.2096 D for t-FA (Kuze et al. 1982) and 2.71 D for c-FA (Hocking 1976). We find that a rotational temperature of 4.5 K reproduces the relative intensities of the three available lines of c-FA. The column density derived for c-FA is (5.3 ± 0.5) × 1010 cm−2, also assuming an emission size of 40″ of radius. Therefore, the abundance of the cis isomer of formic acid in TMC-1 is ~6% of that of the trans isomer (trans/cis of 17.5), in excellent agreement with the values derived in the cold dense clouds B5 (Taquet et al. 2017) and L483 (Agúndez et al. 2019), and substantially lower than the value of ~35% (trans/cis of 2.9) derived in the Orion Bar PDR (Cuadrado et al. 2016), where photoswitching seems to be the dominant formation pathway to c-FA.
Observed line parameters of c/t-FA in TMC-1.
Initial physical conditions in our models: nH2 is the H2 density, Av the extinction coefficient, ζ the cosmic-ray ionization rate, and Tg and Td are the gas and dust temperature, respectively.
3 Chemical models
3.1 Model description
To interpret the observed t-FA/c-FA, we performed astrochemical modeling using rate equations. Specifically, we employed the three-phase chemical model ROKKO, as described in Furuya et al. (2015). The chemical network was based on a modified version of the Garrod (2013) network, adapted ad hoc to incorporate recent advances in our understanding of formic acid chemistry. All major modifications to the reaction network are enumerated in Appendix B. The physical conditions of our chemical model are the standard ones for a dark cloud model (Agúndez & Wakelam 2013) and are given in Table 2. The grain chemistry simulated in the model is based on the assumption that all potential reaction events follow a diffusion-reaction competition scheme (Chang et al. 2007). In this context, the most important quantity is the binding energy (BE) of the H atom that we set to 450 K and made equal to the one of H2 (Hendrix et al. 2024; Cuppen & Herbst 2007). Besides, the binding energy of C atoms is set to 10 000 K to reflect chemisorption (Molpeceres et al. 2021; Potapov et al. 2021). All the other binding energies were extracted directly from the Garrod (2013) reaction network; the only exceptions were FA and HOCO, where our own derived values were used (Molpeceres et al. 2022, 2023)2. The H2 surface coverage was treated as an adsorption-desorption equilibrium (Furuya et al. 2019; Furuya 2024). The diffusion energy of a given adsorbate is defined as 0.4 its binding energy (Cuppen et al. 2017), except for the case of CO, where the experimentally derived value of ~0.25 is used (Furuya et al. 2022)3. We neglected the mantle chemistry in our model, both thermal and non-thermal (Jin & Garrod 2020), allowing for only thermal surface chemistry in the four topmost layers of the dust particle, which was modeled based on the assumption of 0.1 μm radius particles.
To properly reproduce the gas-phase abundances of molecules formed on the surface of dust grains, we included a series of non-thermal desorption mechanisms into the model; namely, photodesorption, both from the interstellar (attenuated) radiation field and the secondary UV field, with a yield of 1×10⁻³. Second, we included stochastic heating of cosmic dust caused by cosmic-ray grain interaction with a temperature of 70 K and a time of 10 μs per collision event (Hasegawa & Herbst 1993). The most important non-thermal effect included in our simulations is chemical desorption (CD), for which we considered the Garrod et al. (2007) formulation with an a coefficient of 0.01. In Garrod et al. (2007), a is the ratio of the bond frequency of the adsorbate-surface normal mode over the rest of vibrational modes that are used for relaxation, always assuming reaction energy equipartition. The astrochemical community has still not reached a consensus around the feasability of CD for relatively large organic molecules such as FA. However, our recent simulations (Molpeceres et al. 2023) showed that CD probability is binding site-dependent, thereby supporting the notion that it should remain a possibility for most adsorbates. A novel component of this work is the split of chemical desorption into the different product channels of FA:
![Mathematical equation: $\[\text { t-HOCO(i) + H(i) } \longrightarrow \mathrm{c}-\mathrm{HCOOH}(\mathrm{g})\]$](/articles/aa/full_html/2025/11/aa55969-25/aa55969-25-eq6.png) (1)
(1)
![Mathematical equation: $\[\longrightarrow \text{t-}\mathrm{HCOOH}(\mathrm{g}),\]$](/articles/aa/full_html/2025/11/aa55969-25/aa55969-25-eq7.png) (2)
(2)
where (i) and (g) indicate “ice” and “gas,” The logic behind this implementation is that when a molecule desorbs through CD, it does so with a fraction of the reaction energy that could not be dissipated. Because the ice partly dissipates the energy (Pantaleone et al. 2021; Ferrero et al. 2023; Molpeceres et al. 2023), dissociation is an unlikely outcome and, therefore, isomerization to exothermic channels is possible. This mechanism is labeled in this work as isomerization-upon-desorption (IUD) and must be dependent on the fraction of energy remaining on the molecule after desorption. Because IUD is an effect that warrants a more in-depth investigation, we performed a sensitivity analysis on the impact of varying c/t values in this reaction (Section 3.2), varying a between the two reaction channels (they both sum up to the 0.01 value used for the rest of the molecules) and making it the free parameter for the model. While an IUD probability can also be defined from the reaction (c-HOCO(i) + H(i)), in this case, the process points in the endothermic direction and, thus, it contributes less significantly. Nevertheless, the effect of this channel is implicitly accounted for in the sensitivity analysis used to constrain the best-fitting model using reactions (1) and (2), as discussed in Section 3.2.
As mentioned above, the reaction network used in this work is a significantly modified version of the Garrod (2013) one. Apart from H2, all the remaining elements were set in its atomic form at the beginning of the simulations, either neutral or ionic depending on their ionization potential (Table 3). We also tested different sets of initial abundances, including the higher metallicity values proposed by Wakelam et al. (2021). These tests showed a noticeable effect on the overall abundances with minor importance for c/t. The low-metallicity values are motivated by the ratio of microcanonical rate constants for isomerization discussed in Section 3.2. It should be stressed, however, that our results depend on the IUD introduced above, which remains a free parameter in the model. A more extensive exploration of this parameter space would be warranted if the model were to be extended, although for our present purposes, the current choice is sufficient.
The main change in the chemical reaction network pertaining this article is the duplication of all HOCO and HCOOH entries in the network into c-HOCO, t-HOCO, c-HCOOH, and t-HCOOH. Furthermore, the inclusion of the whole FA/CO2 reaction network compiled from a series of works (García de la Concepción et al. 2022; Molpeceres et al. 2022; García de la Concepción et al. 2023; Molpeceres et al. 2023, 2025) was expanded with several gas-phase destruction reactions. Finally, there is the aforementioned inclusion of the IUD. Finally, along with the IUD, we also implemented an additional type of reaction, unimolecular isomerization in the gas phase to interconvert trans/cis isomers, particularly FA and HOCO, as
![Mathematical equation: $\[\text{t-}\mathrm{HCOOH}(\mathrm{g}) \rightleftharpoons \text{c-}\mathrm{HCOOH}(\mathrm{g})\]$](/articles/aa/full_html/2025/11/aa55969-25/aa55969-25-eq8.png) (3)
(3)
or:
![Mathematical equation: $\[\text{t-}\mathrm{HCOOH}(\mathrm{g}) \longrightarrow \text{c-}\mathrm{HCOOH}(\mathrm{g}),\]$](/articles/aa/full_html/2025/11/aa55969-25/aa55969-25-eq9.png) (4)
(4)
![Mathematical equation: $\[\text{c-}\mathrm{HCOOH}(\mathrm{g}) \longrightarrow \text{t-}\mathrm{HCOOH}(\mathrm{g}).\]$](/articles/aa/full_html/2025/11/aa55969-25/aa55969-25-eq10.png) (5)
(5)
The rate constant for this process is simply expressed as kiso=α, where α is a value (not interpolated)4 extracted from Table 1 of García de la Concepción et al. (2022). An enumeration of all the changes in the reaction network is collated in Appendix B, with the most important reactions (some of them mentioned previously) listed below:
![Mathematical equation: $\[\mathrm{CO}(\mathrm{i})+\mathrm{OH}(\mathrm{i}) \longrightarrow \text{t-}\mathrm{HOCO}(\mathrm{i}) \qquad E_{\mathrm{a}}=100 \mathrm{~K},\]$](/articles/aa/full_html/2025/11/aa55969-25/aa55969-25-eq11.png) (6)
(6)
![Mathematical equation: $\[\mathrm{CO}(\mathrm{i})+\mathrm{OH}(\mathrm{i}) \longrightarrow \text{c-}\mathrm{HOCO}(\mathrm{i}) \qquad E_{\mathrm{a}}=100 \mathrm{~K},\]$](/articles/aa/full_html/2025/11/aa55969-25/aa55969-25-eq12.png) (7)
(7)
![Mathematical equation: $\[\text{c-}\mathrm{HOCO}(\mathrm{i})+\mathrm{H}(\mathrm{i}) \longrightarrow \text{t-}\mathrm{HCOOH}(\mathrm{i}) \qquad E_{\mathrm{a}}=0 \mathrm{~K},\]$](/articles/aa/full_html/2025/11/aa55969-25/aa55969-25-eq13.png) (8)
(8)
![Mathematical equation: $\[\text{c-}\mathrm{HOCO}(\mathrm{i})+\mathrm{H}(\mathrm{i}) \longrightarrow \text{t-}\mathrm{HCOOH}(\mathrm{g}) \qquad E_{\mathrm{a}}=0 \mathrm{~K},\]$](/articles/aa/full_html/2025/11/aa55969-25/aa55969-25-eq14.png) (9)
(9)
![Mathematical equation: $\[\text{t-}\mathrm{HOCO}(\mathrm{i})+\mathrm{H}(\mathrm{i}) \longrightarrow \text{c-}\mathrm{HCOOH}(\mathrm{i}) \qquad E_{\mathrm{a}}=0 \mathrm{~K},\]$](/articles/aa/full_html/2025/11/aa55969-25/aa55969-25-eq15.png) (10)
(10)
![Mathematical equation: $\[\text{t-}\mathrm{HOCO}(\mathrm{i})+\mathrm{H}(\mathrm{i}) \longrightarrow \text{c-}\mathrm{HCOOH}(\mathrm{g}) \qquad E_{\mathrm{a}}=0 \mathrm{~K},\]$](/articles/aa/full_html/2025/11/aa55969-25/aa55969-25-eq16.png) (11)
(11)
![Mathematical equation: $\[\text{t-}\mathrm{HOCO}(\mathrm{i})+\mathrm{H}(\mathrm{i}) \longrightarrow \text{t-}\mathrm{HCOOH}(\mathrm{g}) \qquad E_{\mathrm{a}}=0 \mathrm{~K},\]$](/articles/aa/full_html/2025/11/aa55969-25/aa55969-25-eq17.png) (12)
(12)
![Mathematical equation: $\[\text{c-}\mathrm{HCOOH}(\mathrm{i})+\mathrm{H}(\mathrm{i}) \longrightarrow \text{t-}\mathrm{HOCO}(\mathrm{i})+\mathrm{H}_2(\mathrm{i}) \qquad E_{\mathrm{a}}=3240 \mathrm{~K},\]$](/articles/aa/full_html/2025/11/aa55969-25/aa55969-25-eq18.png) (13)
(13)
![Mathematical equation: $\[\text{t-}\mathrm{HCOOH}(\mathrm{i})+\mathrm{H}(\mathrm{i}) \longrightarrow \text{c-}\mathrm{HOCO}(\mathrm{i})+\mathrm{H}_2(\mathrm{i}) \qquad E_{\mathrm{a}}=4830 \mathrm{~K},\]$](/articles/aa/full_html/2025/11/aa55969-25/aa55969-25-eq19.png) (14)
(14)
![Mathematical equation: $\[\text{t-}\mathrm{HCOOH}(\mathrm{g}) \rightleftharpoons \text{c-}\mathrm{HCOOH}(\mathrm{g}) \qquad \text { See footnote } 4,\]$](/articles/aa/full_html/2025/11/aa55969-25/aa55969-25-eq20.png) (15)
(15)
![Mathematical equation: $\[\text{c-}\mathrm{HOCO}(\mathrm{i})+\mathrm{H}(\mathrm{i}) \longrightarrow \mathrm{CO}_2(\mathrm{i})+\mathrm{H}_2(\mathrm{i}) \qquad E_{\mathrm{a}}=301 \mathrm{~K},\]$](/articles/aa/full_html/2025/11/aa55969-25/aa55969-25-eq21.png) (16)
(16)
![Mathematical equation: $\[\text{t-}\mathrm{HOCO}(\mathrm{i})+\mathrm{H}(\mathrm{i}) \longrightarrow \mathrm{CO}_2(\mathrm{i})+\mathrm{H}_2(\mathrm{i}) \qquad E_{\mathrm{a}}=7340 \mathrm{~K},\]$](/articles/aa/full_html/2025/11/aa55969-25/aa55969-25-eq22.png) (17)
(17)
![Mathematical equation: $\[\text{c-}\mathrm{HOCO}(\mathrm{i})+\mathrm{H}(\mathrm{i}) \longrightarrow \mathrm{CO}(\mathrm{i})+\mathrm{H}_2 \mathrm{O}(\mathrm{i}) \qquad E_{\mathrm{a}}=4120 \mathrm{~K},\]$](/articles/aa/full_html/2025/11/aa55969-25/aa55969-25-eq23.png) (18)
(18)
![Mathematical equation: $\[\text{t-}\mathrm{HOCO}(\mathrm{i})+\mathrm{H}(\mathrm{i}) \longrightarrow \mathrm{CO}(\mathrm{i})+\mathrm{H}_2 \mathrm{O}(\mathrm{i}) \qquad E_{\mathrm{a}}=0 \mathrm{~K}.\]$](/articles/aa/full_html/2025/11/aa55969-25/aa55969-25-eq24.png) (19)
(19)
The HOCO formation reactions (reactions (6) and (7)) are described in Molpeceres et al. (2023)5. The HOCO hydrogenation reactions (reactions (8)–(12); and competition channels (16)–(19)) are modeled after Molpeceres et al. (2025). The H-abstraction reactions (reactions (13)–(14)), for which the rate constants are fitted to match accurate instanton calculations are taken from Molpeceres et al. (2022). The trans-cis equilibrium (i.e., after desorption), with forward and backward rate constants, is taken from García de la Concepción et al. (2022), as indicated above. Lastly, the value of the IUD reaction (11 and 12) are obtained from the sensitivity study shown in the next section.
Initial elemental abundances with respect to H nuclei, taken from Aikawa & Herbst (1999).
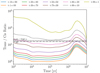 |
Fig. 2 t-FA/c-FA over time as a function of the IUD ratio. In the legend, t and c indicate the isomeric form and the numbers the percentage of desorption of each of them in the t-HOCO + H ⟶ (t/c)–HCOOH reaction. Horizontal lines represent the gas-phase observational abundances of both isomers in the Barnard-5 molecular cloud (Taquet et al. 2017), L483 (Agúndez et al. 2019) and TMC-1 (this work). |
3.2 Results
To determine the optimal model for the observed t/c-FA ratio, we performed a sensitivity analysis of the model on the probability of IUD.6 In essence, this analysis allowed us to constrain the branching ratio of reactions (1) and (2) (and (11) and (12)). The results of this analysis are shown in Figure 2. The grid of models was run with IUD probabilities ranging from 1% to 99% for the formation of t-FA and c-FA. An inspection of Figure 2 reveals that an IUD probability between 70% and 90% is necessary to reproduce the observed t-FA/c-FA in TMC-1, L483, and Barnard-5, depending on the considered timescales. Among these, the best-performing model, selected as the one matching the characteristic timescale of TMC-1 (on the order of 105 yr Pratap et al. 1997, although in our simulations the abundances of B5 are better described than those of TMC-1) corresponds to an IUD probability of 90%, indicating that chemical desorption followed by instantaneous isomerization plays a crucial role in determining the correct t/c-FA and likely influences other interstellar molecules. We adopted the 90% IUD model for the subsequent discussions.
The selection of a high IUD probability can be rationalized by examining the microphysics of chemical desorption. After a chemical desorption event, the isomerization process resembles a microcanonical reaction in the gas phase where the energy available for the reaction is not known, but should be significantly lower than the total reaction energy (Molpeceres et al. 2023), reducing the likelihood of dissociation. The ratio of the microcanonical rate constants for the c-FA ⇌ t-FA isomerization, computed using DFT calculations (ω B97M-D4/def2-TZVPPD; Mardirossian & Head-Gordon 2016; Caldeweyher et al. 2019; Najibi & Goerigk 2020; Rappoport & Furche 2010; Weigend & Ahlrichs 2005) and RRKM theory including quantum tunneling, is shown in Figure 3. We used ORCA6.0.0 and MESS for these calculations (Neese 2012; Neese et al. 2020; Neese 2022; Georgievskii et al. 2013). These rate constants resemble the ones shown in García de la Concepción et al. (2021), but in the microcanonical ensemble (i.e., the one applicable just after a chemical desorption). Without a substrate to interact with, the excess energy can drive back-and-forth isomerizations. The microcanonical rate constant ratio for c-FA to t-FA ranges from approximately 17.5 to 2.0, depending on the residual energy in the molecule after desorption. This indicates that during desorption events, the isomerization of c-FA to t-FA is strongly favored. This aligns well with the results in Figure 2, where models incorporating significant IUD probabilities yield better agreement with observations. Furthermore, since not all desorption events impart the same amount of energy to the desorbing molecule, the average ratio of rate constants will be higher than 2.0. It is improbable that the full reaction energy (approximately 100 kcal mol−1 for the HOCO hydrogenation reaction; Molpeceres et al. 2025) remains in the molecule after desorption, and if so, the molecule would probably simply dissociate, as mentioned above. This strongly supports a high IUD probability, as indicated by our model. However, the exact energy retained by the desorbed molecule is not well constrained and depends on how much energy the dust matrix absorbs during the non-thermal desorption event. It is worth noting that additional non-thermal desorption mechanisms could also influence the t-FA/c-FA. The adoption of a 90% IUD probability might inadvertedly account for other isomerization processes after desorption, such as cosmic-ray sputtering (Dartois et al. 2021) or other non-thermal mechanisms such as desorption by shocks, which could contribute to the observed ratios alongside chemical desorption.
After setting the free parameter of our model, the IUD probability, we ran a chemical model for Tg = Td = 10 K that is equivalent to those where these c-FA have been detected (Taquet et al. 2017; Agúndez et al. 2019) and serves as the main reference for discussing FA isomerism in dark clouds. The results of this model are presented in Figure 4, where in the bottom panel, we copy the results from Figure 2 on a linear scale. A visual inspection reveals a good match between our gas-phase values and the observational data from Barnard 5 (B5) (Taquet et al. 2017), L483 (Agúndez et al. 2019) and TMC-1. Given the strong agreement at 1–5 × 10⁵ yr in the absolute abundances and the predicted t-FA/c-FA (vide infra), we consider that differences in the absolute abundances of t-FA and c-FA in different sources are attributed to the physical conditions of the modeled objects rather than to limitations in the chemical network. Simultaneously reproducing the chemical abundances of three objects with different physical conditions and evolutionary stages is not feasible, particularly when using a pseudo–time-dependent single-point physical model. Nevertheless, the level of agreement achieved is between excellent and acceptable across the three sources, suggesting that the differences arise primarily from the physical conditions of each source, rather than from missing chemical reactions needed to account for FA formation and its isomerism. Our models also show excellent agreement with total FA ice abundances in young stellar objects, predicting a 2–7% abundance relative to H2O ice, consistent with the ranges reported by Boogert et al. (2015) and recently by Rocha et al. (2024). It is important to note that our comparison with observational data includes both neutral FA and the HCOO− ion, an immediate proxy that is not explicitly included in our model. A limitation of our model is that FA and CO2 ices (not shown in Figure 4) are predicted to have similar abundances, whereas observational constraints suggest a CO2/FA ice ratio of 2–3 in favor of CO2 (Boogert et al. 2015; McClure et al. 2023). While this discrepancy does not affect the conclusions of this study, we discuss potential ways to reconcile our models with observations in Appendix C. The agreement portrayed in both panels Figure 4 is explained by the combination of reactions (6)–(19), but it is fair to stress out that this chain of reactions can only be initiated if reactions (6) and (7) proceed as described in Molpeceres et al. (2023) and, more recently, in Ishibashi et al. (2024). This is consistent with Kinetic Montecarlo simulations that suggest the importance of additional CO2 formation reactions (Jiménez-Serra et al. 2025).
Following reactions (6) and (7), the isomer imbalance of FA is caused by the H-addition/H-abstraction cycle shown in Molpeceres et al. (2022, 2025). Briefly, atomic H partakes easily on c-FA H-abstraction (reaction (13)), whereas the same reaction in t-FA is very slow (reaction (14)), creating an isomeric imbalance of several orders of magnitude for the abundances on the ice (see Figure 4, middle panel). However, a more detailed investigation of Figure 4 shows that t-FA/c-FA is markedly lower in the gas (left panel), owing to the increased CD coming from a H-addition/H-abstraction loop that increases the reactive events and therefore the total CD rate for c-FA. This cycle is not present for t-FA because, as we note above, reaction (14) is slow, hence the postulation of the IUD mechanism, also discussed in detail above. Once it is in the gas, c/t-FA interconversion is, at 10 K, strictly out of equilibrium and the chemistry of each isomer can be controlled either by destruction reactions; for instance, with C+, HCO+, and H3+ where the isomer with larger dipole moment is more favorably destroyed by an effect known as the relative dipole principle (RDP) (Shingledecker et al. 2020). Alternatively, it could be controlled by unimolecular isomerization. At 10 K, unimolecular isomerizations rates are negligible for both isomers and, therefore, destruction reactions modulate the isomeric balance that comes from the desorption of the grain.
To investigate the competition of unimolecular isomerization (reaction (15)) with destruction reactions in the gas for c/t-FA after it is desorbed from the grains, we carried out additional numerical experiments simulating a series of fictitious dark clouds, where we varied Tg and assumed a thermal decoupling of gas and grains (Td = 10 K). The results are shown in Figure 5. The first conclusion extracted from the figure is that it is only at 10 K that the ratio is sufficiently low (2×101) to ensure easy c-FA detectability, despite the extremely high equilibrium t-FA/c-FA equilibrium constant (2.1×1088). At 20 K, this ratio is above 103 (which is low), but detection of c-FA might still be possible. At much higher temperatures, the ratio predicted by the models starts to converge to the thermodynamic one. It is important to note, however, that given the dramatic dependence of the thermal isomerization rate constant with temperature and the inherent limitations of the theoretical predictions for these rate constants, the value of 20 K is subjected to uncertainties. At 50 and 70 K, FA destruction reactions including the sequential acid base mechanism shown in García de la Concepción et al. (2023) preclude them from reaching formal thermodynamic equilibrium because their reaction rate surpasses the one of reaction (15) (from right to left). This threshold is surpassed above 90 K, where it is safe to consider thermodynamic equilibrium, which is characterized by a totally horizontal line in the time evolution of t-FA/c-FA (Figure 5). The exact temperature at which thermodynamic equilibrium is reached is difficult to pinpoint, as it strongly depends on the completeness of the chemical network. For example, if currently unexplored reactions in the FA network, such as HOCO+ + H2, play a significant role, the upper limit of the equilibrium temperature range might shift accordingly. At lower temperatures, the contribution from grain-surface processes clearly dominates. To sum up, the immediate conclusion of this set of models is that c-HCOOH in dark clouds is a consequence of out-of-equilibrium conditions and that its temperature range of existence is narrow. Our models predict a dramatic decrease in c-HCOOH abundance under the detectability limits at temperatures above 50 K; this explains, for example, its absence in hot cores. In environments that are more energetic than cold dark clouds, but not as extreme as hot cores (e.g., the G+0.693–0.027 molecular cloud, where shocks and elevated cosmic-ray ionization rates are present), formic acid might be gradually released from dust grains into the gas phase. This could account for detections such as our recent observation of t-HCOOCH3 (Sanz-Novo et al. 2025). However, if the tentative detection of c-FA in this cloud (Sanz-Novo et al. 2023) is confirmed, the resulting t-FA/c-FA values would be at least an order of magnitude higher than those typically found in dark clouds.
The stringent conditions for the detectability of c-FA make this molecule a viable cloud temperature tracer, although such a role can only be effectively exploited with very precise rate constants for isomerization, likely exceeding our current theoretical frameworks. Finally, we recall here that the rationalizations made in this work are only applicable in the absence of a strong interstellar UV field, since it has been reported that near IR pumping is capable of explaining the presence of c-FA in photodissociation regions (Cuadrado et al. 2016).
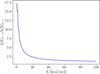 |
Fig. 3 Microcanonical rate constant ratio for the c-FA and t-FA IUD. The limit on the x-axis is determined from the reaction energy for the HOCO radical hydrogenation on ices (Molpeceres et al. 2025) in between 90 and 105 kcal mol−1 depending on factors as the HOCO isomer being hydrogenated or the ice binding site. The energy of c-FA is set as the origin of energies. |
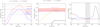 |
Fig. 4 Left panel: chemical model using the best performing model for c-FA and t-FA in the gas. Horizontal bands represent the range of observational abundances with respect to H2 of both isomers in the three clouds where they have been detected, the Barnard-5 molecular cloud (Taquet et al. 2017), L483 (Agúndez et al. 2019) and TMC-1 (This work). Middle panel: equivalent to above but for ice abundances (comparing with H2O) and comparing with the upper and lower bounds provided in Boogert et al. (2015) and with the well constrained narrow band of Rocha et al. (2024). We note that HCOOH and HCOO− are summed in establishing the observational abundances. Right panel: t-FA/c-FA gas phase ratios for the best performing model in linear scale. The gray area represents an approximated characteristic timescale of TMC-1 (Pratap et al. 1997). |
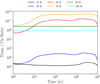 |
Fig. 5 Gas phase t-FA/c-FA for different Tg. Td is kept constant (10 K). Horizontal lines indicate that chemical equilibrium is reached. The equilibrium constants are, according to García de la Concepción et al. (2022), Kt/c(10 K)=2.1(88), Kt/c(20 K)=1.5(44), Kt/c(50 K)=4.7(17), Kt/c(70 K)=4.3(12), Kt/c(90 K)=6.7(9), and Kt/c(100 K)=7.0(8). A(B) is equivalent to A×10B. |
4 Conclusions: Formic acid isomerism in dark clouds
The picture that emerges from our detection of c-FA in TMC-1 and subsequent chemical modeling is detailed below. The total abundance of formic acid can only be explained by considering its formation via the HOCO intermediate through the CO + OH reaction. When this pathway is included, FA ice abundances align well with those reported in ice observations. Introducing the isomeric dimension reveals that most FA on ice exists as t-FA, owing to its greater resistance to hydrogenation compared to c-FA. The lower resistance of c-FA on ice to hydrogenation triggers an H-abstraction and H-addition cycle that promotes chemical desorption, enriching the cold gas with FA. Crucially, the inclusion of the IUD mechanism is key to cross-matching with observations. This mechanism suggests that any excess energy released during a non-thermal desorption event (e.g., chemical desorption) can subsequently drive isomerization. By incorporating this mechanism, our model successfully reproduces the observed abundances of t-FA and c-FA in dark clouds, as well as their relative ratios. A detailed analysis of the temperature dependence of these ratios reveals that, in the gas phase, c-FA abundance declines to undetectable levels at temperatures above 50 K and possibly lower. This explains the absence of c-FA in warmer astronomical environments, such as hot cores. The comprehensive rationalization of FA’s isomeric chemistry provides a robust framework for understanding the detectability of high-energy isomers in the ISM and paves the way for applying this approach to other molecular species.
Finally, this work underscores the importance of non-thermal, energetic mechanisms in shaping the molecular and isomeric inventory of cold dark clouds. The interplay between these mechanisms and thermal processes is critical for understanding the chemical evolution of the ISM. Our ad hoc addition of a non-thermal (microcanonical) isomerization mechanism to the chemical network highlights the need for further investigation, which we plan to address in future studies.
Data availability
The full reaction network used in this work can be retrieved at ZENODO.
Acknowledgements
Based on observations carried out with the Yebes 40m telescope (projects 19A003, 20A014, 20D023, 21A011, 21D005, and 23A024). The 40m radio telescope at Yebes Observatory is operated by the Spanish Geographic Institute (IGN; Ministerio de Transportes, Movilidad y Agenda Urbana). We thank Dr. Kenji Furuya for the newest release of the ROKKO code. G.M acknowledges the support of the grant RYC2022-035442-I funded by MCIU/AEI/10.130 39/501100011033 and ESF+. G.M. also received support from project 20245AT016 (Proyectos Intramurales CSIC). We acknowledge the computational resources provided by the DRAGO computer cluster managed by SGAI-CSIC, and the Galician Supercomputing Center (CESGA). The supercomputer FinisTerrae III and its permanent data storage system have been funded by the Spanish Ministry of Science and Innovation, the Galician Government and the European Regional Development Fund (ERDF). We also thank ERC for funding through grant ERC-2013-Syg-610256-NANOCOSMOS. This publication is part of the project PID2023-147545NB-I00 funded by MICIU/AEI/10.13039/501100011033. M.S.-N acknowledges a Juan de la Cierva Postdoctoral Fellow project JDC2022-048934-I, funded by MICIU/AEI/10.13039/501100011033 and by the European Union “Next GenerationEU/PRTR”. V.M.R. acknowledges support from the grant PID2022-136814NB-I00 by the Spanish Ministry of Science, Innovation and Universities/State Agency of Research MICIU/AEI/10.13039/501100011033 and by ERDF, UE; the grant RYC2020-029387-I funded by MICIU/AEI/10.13039/501100011033 and by “ESF, Investing in your future”, and from the Consejo Superior de Investigaciones Científicas (CSIC) and the Centro de Astrobiología (CAB) through the project 20225AT015 (Proyectos intramurales especiales del CSIC); and from the grant CNS2023-144464 funded by MICIU/AEI/10.13039/501100011033 and by “European Union NextGenerationEU/PRTR”. I.J-.S acknowledges funding from the ERC Consolidator grant OPENS (project number 101125858) funded by the European Union, and from grant PID2022-136814NB-I00 funded by the Spanish Ministry of Science, Innovation and Universities/State Agency of Research MICIU/AEI/10.13039/501100011033 and by “ERDF/EU”. JGdlC also acknowledge European Funds of Regional Development, and the Autonomous Government of Extremadura (Grant GR24020).
Appendix A Rotation diagram for t-FA
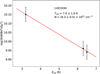 |
Fig. A.1 Rotation diagram for t-HCOOH in TMC-1. |
Appendix B Summary of additions to the reaction network
A summary of the main modifications of the Garrod (2013) reaction network used in this work is enumerated below. In the reaction network provided (see “Data availability section”), COOH and HCOOH are the old isomer non-inclusive HOCO radical and FA for whom all reactions are deactivated. By contrast, the isomer inclusive species are cCOOH, tCOOH, cHCOOH and tHCOOH.
Substitution of conventional CO2 chemistry through the CO + OH ⟶ CO2 + H reaction by the newer CO + OH ⟶ c/t-HOCO followed by hydrogenation, HOCO + H ⟶ CO2 + H2, HOCO + H ⟶ HCOOH and HOCO + H ⟶ CO + H2O Molpeceres et al. (2023); Ishibashi et al. (2024); Molpeceres et al. (2025).
Splitting of HOCO and HCOOH chemistry into their isomeric forms c-HOCO, t-HOCO, c-HCOOH, t-HCOOH, with the main formation (see below) and destruction reactions (H3+, HCO+, C+) made distinct for each isomer.
Inclusion of carbon atom chemisorption Molpeceres et al. (2021); Potapov et al. (2021); Tsuge et al. (2023)
Destruction reactions of HCOOH with HCO+ and sequential base reaction with NH3 following García de la Concepción et al. (2023).
Updated values of ion-molecule destruction reactions of c-HOCO, t-HOCO, c-HCOOH, t-HCOOH with C+, H3+, and HCO+. Values for the rate constant were obtained from the Su-Chesnavich formula (Su & Chesnavich 1982) and fitted to a three-term Arrhenius expression. Dipole moments and polarizabilities are taken from García de la Concepción et al. (2023) for HCOOH and our own quantum chemical calculations (B2PLYP-D3BJ/aug-cc-pVTZ) for HOCO.
Addition of the isomerization-upon-desorption mechanism for t-HOCO + H, as indicated in the main text.
Inclusion of ion-grain recombination reactions to all cations in the reaction network.
Appendix C Improving CO2 ice formation
We mention in the main text that while our model predicts FA abundances and in particular trans-cis ratios correctly, CO2 showed unrealistic abundances with respect to ice observations (Boogert et al. 2015; McClure et al. 2023). The reason for the mismatch is that, when developing the FA/CO2 reaction network according to Molpeceres et al. (2022, 2023); Ishibashi et al. (2024); Molpeceres et al. (2025), i.e., slow down CO2 formation through the HOCO radical instead of CO + OH ⟶ CO2 + H, the abundance of CO2 decreases. The reduction is a factor 2-3 with respect to the observations. However, not including the changes totally banishes FA chemistry, which poses an even larger observational conundrum, especially in light of contemporary observations. In this Appendix we show that we can reconcile CO2 and FA abundances by simply enhancing oxygen atom diffusion in our models. In Figure C.1, we show the ice abundances of CO2 and FA with models using different values of Ediff/Ebin exclusively for the O atom (in addition to the experimentally constrained value of CO, Furuya et al. 2022), as a proxy for varying the diffusion energy. We observe that a lowering of the factor (originally 0.40; black dotted line) to the range of 0.25–0.30, in accordance with the values for CO and other closed shell adsorbates (Furuya et al. 2022) allows us to reproduce observational evidence of CO2, with minimal change with respect to FA abundance for which the observational agreement is good in all cases.
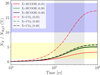 |
Fig. C.1 Sensitivity analysis of our model to the oxygen atom diffusion energy for CO2 ice (dashed lines) and FA (suming c-t abundances). Values are represented with respect to H2O column density- The difussion Ediff energy is defined from the Ediff/Ebin parameter in our models. Ediff/Ebin is set to 0.25, 0.30 and 0.40 in those models. The pale blue zone represents the observationally constrained abundances of CO2 (Boogert et al. 2015; McClure et al. 2023) and the pale yellow zone represent the same for FA (Boogert et al. 2015; Rocha et al. 2024). We assume that FA and HCOO− abundances sum. |
The reason for changing the diffusion energy of the O atom is that, when O atom becomes more mobile on the surface the following reactions are activated:
![Mathematical equation: $\[\mathrm{HCO}+\mathrm{O} \longrightarrow \mathrm{CO}_2+\mathrm{H},\]$](/articles/aa/full_html/2025/11/aa55969-25/aa55969-25-eq25.png) (C.1)
(C.1)
![Mathematical equation: $\[\mathrm{CO}+\mathrm{O} \longrightarrow \mathrm{CO}_2.\]$](/articles/aa/full_html/2025/11/aa55969-25/aa55969-25-eq26.png) (C.2)
(C.2)
Because these reactions do not interfere with the FA formation network, they allow for an independent match between FA and CO2. This finding sums to the increasing body of evidence indicating that interstellar icy CO2 forms in alternative ways to the ones traditionally considered (Jiménez-Serra et al. 2025) and strengthens the need for a dedicated quantum chemical or experimental study on the pair of reactions shown above.
Finally, it remains to consider whether arbitrarily varying Ediff/Ebin is a good practice to explain the CO2 discrepancies. While certainly Ediff/Ebin cannot be constrained in this way, there is experimental evidence to believe that many adsorbates can have an average value below 0.4–0.5 (Furuya et al. 2022) contrary to what was anticipated earlier (including O atoms) (Minissale et al. 2016; Cuppen et al. 2017). This makes considering a lower Ediff/Ebin justified in light of the astrochemical contemporary advances. Nevertheless, a more elegant explanation for the diffusion of O- atoms can be found when describing binding and diffusion with binding energy distributions instead of single values, where O-atoms in low binding sites will diffuse and recombine fast as shown in Furuya (2024) where, unsurprisingly, icy CO2 is one of the most affected species by the inclusion of a multibinding approach.
References
- Agúndez, M., & Wakelam, V. 2013, Chem. Rev., 113, 8710 [Google Scholar]
- Agúndez, M., Marcelino, N., Cernicharo, J., & Tafalla, M. 2018, A&A, 611, L1 [NASA ADS] [CrossRef] [EDP Sciences] [Google Scholar]
- Agúndez, M., Marcelino, N., Cernicharo, J., et al. 2019, A&A, 625, A147 [NASA ADS] [CrossRef] [EDP Sciences] [Google Scholar]
- Agúndez, M., Roncero, O., Marcelino, N., et al. 2023, A&A, 673, A24 [NASA ADS] [CrossRef] [EDP Sciences] [Google Scholar]
- Agúndez, M., Molpeceres, G., Cabezas, C., et al. 2025, A&A, 693, L20 [NASA ADS] [CrossRef] [EDP Sciences] [Google Scholar]
- Aikawa, Y., & Herbst, E. 1999, ApJ, 526, 314 [Google Scholar]
- Ballotta, B., Nandi, S., Barone, V., & Rampino, S. 2021, ACS Earth Space Chem., 5, 1071 [Google Scholar]
- Boogert, A. C. A., Gerakines, P. A., & Whittet, D. C. B. 2015, ARA&A, 53, 541 [Google Scholar]
- Brünken, S., Gottlieb, C. A., McCarthy, M. C., & Thaddeus, P. 2009, ApJ, 697, 880 [CrossRef] [Google Scholar]
- Cabezas, C., Agúndez, M., Marcelino, N., et al. 2021, A&A, 654, A45 [NASA ADS] [CrossRef] [EDP Sciences] [Google Scholar]
- Cabezas, C., Agúndez, M., Marcelino, N., et al. 2025, A&A, 693, L14 [NASA ADS] [CrossRef] [EDP Sciences] [Google Scholar]
- Caldeweyher, E., Ehlert, S., Hansen, A., et al. 2019, J. Chem. Phys., 150, 154122 [Google Scholar]
- Cernicharo, J., Agúndez, M., Kaiser, R. I., et al. 2021a, A&A, 655, L1 [NASA ADS] [CrossRef] [EDP Sciences] [Google Scholar]
- Cernicharo, J., Agúndez, M., Kaiser, R. I., et al. 2021b, A&A, 652, L9 [NASA ADS] [CrossRef] [EDP Sciences] [Google Scholar]
- Cernicharo, J., Fuentetaja, R., Cabezas, C., et al. 2022, A&A, 663, L5 [NASA ADS] [CrossRef] [EDP Sciences] [Google Scholar]
- Cernicharo, J., Tercero, B., Marcelino, N., et al. 2023, A&A, 674, L4 [NASA ADS] [CrossRef] [EDP Sciences] [Google Scholar]
- Cernicharo, J., Cabezas, C., Fuentetaja, R., et al. 2024, A&A, 690, L13 [NASA ADS] [CrossRef] [EDP Sciences] [Google Scholar]
- Chang, Q., Cuppen, H. M., & Herbst, E. 2007, A&A, 469, 973 [NASA ADS] [CrossRef] [EDP Sciences] [Google Scholar]
- Chataigner, I., Pauzat, F., Tasseau, O., et al. 2024, A&A, 689, A118 [NASA ADS] [CrossRef] [EDP Sciences] [Google Scholar]
- Cuadrado, S., Goicoechea, J. R., Roncero, O., et al. 2016, A&A, 596, L1 [NASA ADS] [CrossRef] [EDP Sciences] [Google Scholar]
- Cuppen, H. M., & Herbst, E. 2007, ApJ, 668, 294 [Google Scholar]
- Cuppen, H. M., Walsh, C., Lamberts, T., 2017, SSRv, 212, 1 [Google Scholar]
- Dartois, E., Chabot, M., Id Barkach, T., et al. 2021, A&A, 647, A177 [EDP Sciences] [Google Scholar]
- Esplugues, G., Rodríguez-Baras, M., Navarro-Almaida, D., et al. 2024, A&A, 692, A5 [NASA ADS] [CrossRef] [EDP Sciences] [Google Scholar]
- Ferrero, S., Pantaleone, S., Ceccarelli, C., et al. 2023, ApJ, 944, 142 [NASA ADS] [CrossRef] [Google Scholar]
- Fuente, A., Rivière-Marichalar, P., Beitia-Antero, L., et al. 2023, A&A, 670, A114 [NASA ADS] [CrossRef] [EDP Sciences] [Google Scholar]
- Furuya, K. 2024, ApJ, 974, 115 [NASA ADS] [CrossRef] [Google Scholar]
- Furuya, K., Aikawa, Y., Hincelin, U., et al. 2015, A&A, 584, A124 [NASA ADS] [CrossRef] [EDP Sciences] [Google Scholar]
- Furuya, K., Aikawa, Y., Hama, T., et al. 2019, ApJ, 882, 172 [NASA ADS] [CrossRef] [Google Scholar]
- Furuya, K., Hama, T., Oba, Y., et al. 2022, ApJ, 933, L16 [CrossRef] [Google Scholar]
- García de la Concepción, J., Jiménez-Serra, I., Corchado, J. C., Rivilla, V. M., & Martín-Pintado, J. 2021, ApJ, 912, L6 [CrossRef] [Google Scholar]
- García de la Concepción, J., Colzi, L., Jiménez-Serra, I., et al. 2022, A&A, 658, A150 [NASA ADS] [CrossRef] [EDP Sciences] [Google Scholar]
- García de la Concepción, J., Jiménez-Serra, I., Corchado, J. C., et al. 2023, A&A, 675, A109 [Google Scholar]
- Garrod, R. T. 2013, ApJ, 765, 60 [Google Scholar]
- Garrod, R. T., Wakelam, V., & Herbst, E. 2007, A&A, 467, 1103 [NASA ADS] [CrossRef] [EDP Sciences] [Google Scholar]
- Georgievskii, Y., Miller, J. A., Burke, M. P., & Klippenstein S. J. 2013, J. Phys. Chem. A, 117, 12146 [NASA ADS] [CrossRef] [Google Scholar]
- Hasegawa, T. I., & Herbst, E. 1993, MNRAS, 263, 589 [Google Scholar]
- Hendrix, J., Bera, P. P., Lee, T. J., & Head-Gordon, M. 2024, Mol. Phys., 122, e2252100 [NASA ADS] [CrossRef] [Google Scholar]
- Hocking, W. H. 1976, Z. Naturforsch., 31a, 1113 [Google Scholar]
- Georgievskii, Y., Miller, J. A., Burke M. P., & Klippenstein, S. J. 2013, J. Phys. Chem. A, 117, 12146 [NASA ADS] [CrossRef] [Google Scholar]
- Ishibashi, A., Hidaka, H., Oba, Y., et al. 2021, ApJ, 921, L13 [NASA ADS] [CrossRef] [Google Scholar]
- Ishibashi, A., Molpeceres, G., Hidaka, H., et al. 2024, ApJ, 976, 162 [Google Scholar]
- Jiménez-Serra, I., Megías, A., Salaris, J., et al. 2025, A&A, 695, A247 [NASA ADS] [CrossRef] [EDP Sciences] [Google Scholar]
- Jin, M., & Garrod, R. T. 2020, ApJS, 249, 26 [Google Scholar]
- Kuze, H., Kuga, T., & Shimizu, T. 1982, J. Mol. Spectr., 93, 248 [Google Scholar]
- Laas, J. C., Garrod, R. T., Herbst, E., & Widicus Weaver, S. L. 2011, ApJ, 728, 71 [Google Scholar]
- Lattelais, M., Pauzat, F., Ellinger, Y., & Ceccarelli, C. 2009, ApJ, 696, L133 [Google Scholar]
- Loomis, R. A., Zaleski, D. P., Steber, A. L., et al. 2013, ApJ, 765, L9 [Google Scholar]
- Loomis, R. A., McGuire, B. A., Shingledecker, C., et al. 2015, ApJ, 799, 34 [Google Scholar]
- Mardirossian, N., & Head-Gordon, M. 2016, J. Chem. Phys., 144, 214110 [NASA ADS] [CrossRef] [Google Scholar]
- McClure, M. K., Rocha, W. R. M., Pontoppidan, K. M., et al. 2023, Nat. Astron., 7, 431 [NASA ADS] [CrossRef] [Google Scholar]
- McGuire, B. A., Carroll, P. B., Loomis, R. A., et al. 2016, Science, 352, 1449 [Google Scholar]
- Marcelino, N., Cernicharo, J., Tercero, B., & Roueff, E. 2009, ApJ, 690, L27 [CrossRef] [Google Scholar]
- Marcelino, N., Tercero, B., Agúndez, M., & Cernicharo, J. 2021, A&A, 646, A10 [NASA ADS] [CrossRef] [EDP Sciences] [Google Scholar]
- Minissale, M., Congiu, E., & Dulieu, F. 2016, A&A, 585, A24 [NASA ADS] [CrossRef] [EDP Sciences] [Google Scholar]
- Molpeceres, G., Kästner, J., Fedoseev, G., et al. 2021, J. Phys. Chem. Lett., 12, 10854 [CrossRef] [Google Scholar]
- Molpeceres, G., Jiménez-Serra, I., Oba, Y., et al. 2022, A&A, 663, A41 [NASA ADS] [CrossRef] [EDP Sciences] [Google Scholar]
- Molpeceres, G., Enrique-Romero, J., & Aikawa, Y. 2023, A&A, 677, A39 [NASA ADS] [CrossRef] [EDP Sciences] [Google Scholar]
- Molpeceres, G., Zaverkin, V., Furuya, K., et al. 2023, A&A, 673, A51 [NASA ADS] [CrossRef] [EDP Sciences] [Google Scholar]
- Molpeceres, G., Enrique-Romero, J., Ishibashi, A., et al. 2025, MNRAS, 538, 1565 [Google Scholar]
- Najibi, A., & Goerigk, L. 2020, J. Comput. Chem., 41, 2562 [CrossRef] [Google Scholar]
- Neese, F. 2012, WIREs Comput. Mol. Sci., 2, 73 [CrossRef] [Google Scholar]
- Neese, F. 2022, WIREs Comput. Mol. Sci., 12, e1606 [Google Scholar]
- Neese, F., Wennmohs, F., Becker, U., & Riplinger, C. 2020, J. Chem. Phys., 152, 224108 [NASA ADS] [CrossRef] [Google Scholar]
- Pantaleone, S., Enrique-Romero, J., Ceccarelli, C., et al. 2021, ApJ, 917, 49 [CrossRef] [Google Scholar]
- Potapov, A., Krasnokutski, S. A., Jäger, C., & Henning, T. 2021, ApJ, 920, 111 [CrossRef] [Google Scholar]
- Pratap, P., Dickens, J. E., Snell, R. L., et al. 1997, ApJ, 486, 862 [Google Scholar]
- Rappoport, D., & Furche, F. 2010, J. Chem. Phys., 133, 134105 [Google Scholar]
- Rivilla, V. M., Martín-Pintado, J., Jiménez-Serra, I., et al. 2019, MNRAS, 483, L114 [NASA ADS] [CrossRef] [Google Scholar]
- Rivilla, V. M., Sanz-Novo, M., Jiménez-Serra, I., et al. 2023, ApJ, 953, L20 [NASA ADS] [CrossRef] [Google Scholar]
- Rocha, W. R. M., Van Dishoeck, E. F., Ressler, M. E., et al. 2024, A&A, 683, A124 [NASA ADS] [CrossRef] [EDP Sciences] [Google Scholar]
- San Andrés, D., Rivilla, V. M., Colzi, L., et al. 2024, ApJ, 967, 39 [CrossRef] [Google Scholar]
- Sanz-Novo, M., Molpeceres, G., Rivilla, V. M., & Jiménez-Serra, I. 2025, A&A, 698, A36 [NASA ADS] [CrossRef] [EDP Sciences] [Google Scholar]
- Sanz-Novo, M., Rivilla, V. M., Jiménez-Serra, I., et al. 2023, ApJ, 954, 3 [NASA ADS] [CrossRef] [Google Scholar]
- Shingledecker, C. N., Álvarez-Barcia, S., Korn, V. H., & Kästner, J. 2019, ApJ, 878, 80 [Google Scholar]
- Shingledecker, C., Molpeceres, G., Rivilla, V., Majumdar, L., & Kästner, J. 2020, ApJ, 897, 158 [NASA ADS] [CrossRef] [Google Scholar]
- Su, T., & Chesnavich, W. J. 1982, J. Chem. Phys., 76, 5183 [NASA ADS] [CrossRef] [Google Scholar]
- Taquet, V., Wirström, E. S., Charnley, S. B., et al. 2017, A&A, 607, A20 [NASA ADS] [CrossRef] [EDP Sciences] [Google Scholar]
- Tsuge, M., Molpeceres, G., Aikawa, Y., & Watanabe, N. 2023, Nat. Astron., 7, 1351 [NASA ADS] [CrossRef] [Google Scholar]
- Vazart, F., Latouche, C., Skouteris, D., et al. 2015, ApJ, 810, 111 [NASA ADS] [CrossRef] [Google Scholar]
- Wakelam, V., Dartois, E., Chabot, M., et al. 2021, A&A, 652, A63 [NASA ADS] [CrossRef] [EDP Sciences] [Google Scholar]
- Weigend, F., & Ahlrichs, R. 2005, Phys. Chem. Chem. Phys., 7, 3297 [Google Scholar]
- Zuckerman, B., Ball, J. A., & Gottlieb, C. A. 1971, ApJ, 163, L41 [NASA ADS] [CrossRef] [Google Scholar]
We use the term isomerism broadly here, encompassing positional isomerism (same molecular formula but different atomic connectivity), stereoisomerism (molecules differing only in their three-dimensional spatial arrangement), and conformerism (a subset of stereoisomerism where isomers interconvert via rotation around a single bond, as in the case of formic acid).
Ebin(c-HOCO)=6190 K, Ebin(t-HOCO)=7302 K, Ebin(c-HCOOH)=6227 K, Ebin(t-HCOOH)=6170 K.
Noting that a value of 0.4 for the ratio between diffusion and desorption is not universal, the chemistry of FA is mostly dominated by CO diffusion, for which we set the experimental constrained value (Furuya et al. 2022).
The reason for not interpolating the rate constants is the dramatic dependence of the rate constant with temperature at low temperatures. We preferred to extract the exact values provided in García de la Concepción et al. (2021).
Because these reactions are essentially almost barrierless and non-thermal effects are likely at play, we modeled it assuming a barrier of merely 100 K (Molpeceres et al. 2023).
The probability of IUD is referred with respect the most stable molecule of the isomer pair, in this case t-FA. Hence, a 90% IUD indicates that the isomeric imbalance is attributed to only a single reaction of all the possible reaction channels, in this case: reactions (1) and (2).
All Tables
Initial physical conditions in our models: nH2 is the H2 density, Av the extinction coefficient, ζ the cosmic-ray ionization rate, and Tg and Td are the gas and dust temperature, respectively.
Initial elemental abundances with respect to H nuclei, taken from Aikawa & Herbst (1999).
All Figures
|
Fig. 1 Lines of t-FA and c-FA (left and right panels, respectively) observed in TMC-1. Blanked channels correspond to negative artifacts resulting from the frequency-switching technique. The red lines correspond to the computed line profiles adopting the parameters given in Sect. 2. The lines in top and bottom panels of c-FA have only been marginally detected (See text). |
| In the text | |
|
Fig. 2 t-FA/c-FA over time as a function of the IUD ratio. In the legend, t and c indicate the isomeric form and the numbers the percentage of desorption of each of them in the t-HOCO + H ⟶ (t/c)–HCOOH reaction. Horizontal lines represent the gas-phase observational abundances of both isomers in the Barnard-5 molecular cloud (Taquet et al. 2017), L483 (Agúndez et al. 2019) and TMC-1 (this work). |
| In the text | |
|
Fig. 3 Microcanonical rate constant ratio for the c-FA and t-FA IUD. The limit on the x-axis is determined from the reaction energy for the HOCO radical hydrogenation on ices (Molpeceres et al. 2025) in between 90 and 105 kcal mol−1 depending on factors as the HOCO isomer being hydrogenated or the ice binding site. The energy of c-FA is set as the origin of energies. |
| In the text | |
|
Fig. 4 Left panel: chemical model using the best performing model for c-FA and t-FA in the gas. Horizontal bands represent the range of observational abundances with respect to H2 of both isomers in the three clouds where they have been detected, the Barnard-5 molecular cloud (Taquet et al. 2017), L483 (Agúndez et al. 2019) and TMC-1 (This work). Middle panel: equivalent to above but for ice abundances (comparing with H2O) and comparing with the upper and lower bounds provided in Boogert et al. (2015) and with the well constrained narrow band of Rocha et al. (2024). We note that HCOOH and HCOO− are summed in establishing the observational abundances. Right panel: t-FA/c-FA gas phase ratios for the best performing model in linear scale. The gray area represents an approximated characteristic timescale of TMC-1 (Pratap et al. 1997). |
| In the text | |
|
Fig. 5 Gas phase t-FA/c-FA for different Tg. Td is kept constant (10 K). Horizontal lines indicate that chemical equilibrium is reached. The equilibrium constants are, according to García de la Concepción et al. (2022), Kt/c(10 K)=2.1(88), Kt/c(20 K)=1.5(44), Kt/c(50 K)=4.7(17), Kt/c(70 K)=4.3(12), Kt/c(90 K)=6.7(9), and Kt/c(100 K)=7.0(8). A(B) is equivalent to A×10B. |
| In the text | |
|
Fig. A.1 Rotation diagram for t-HCOOH in TMC-1. |
| In the text | |
|
Fig. C.1 Sensitivity analysis of our model to the oxygen atom diffusion energy for CO2 ice (dashed lines) and FA (suming c-t abundances). Values are represented with respect to H2O column density- The difussion Ediff energy is defined from the Ediff/Ebin parameter in our models. Ediff/Ebin is set to 0.25, 0.30 and 0.40 in those models. The pale blue zone represents the observationally constrained abundances of CO2 (Boogert et al. 2015; McClure et al. 2023) and the pale yellow zone represent the same for FA (Boogert et al. 2015; Rocha et al. 2024). We assume that FA and HCOO− abundances sum. |
| In the text | |
Current usage metrics show cumulative count of Article Views (full-text article views including HTML views, PDF and ePub downloads, according to the available data) and Abstracts Views on Vision4Press platform.
Data correspond to usage on the plateform after 2015. The current usage metrics is available 48-96 hours after online publication and is updated daily on week days.
Initial download of the metrics may take a while.