Fig. 4
Download original image
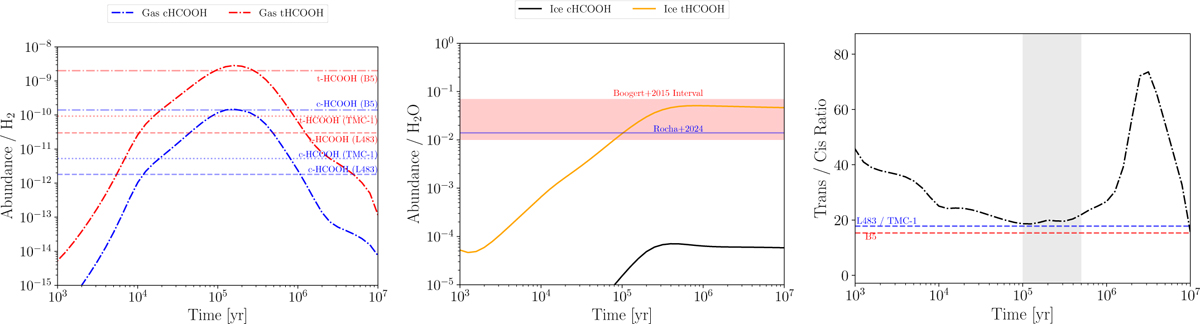
Left panel: chemical model using the best performing model for c-FA and t-FA in the gas. Horizontal bands represent the range of observational abundances with respect to H2 of both isomers in the three clouds where they have been detected, the Barnard-5 molecular cloud (Taquet et al. 2017), L483 (Agúndez et al. 2019) and TMC-1 (This work). Middle panel: equivalent to above but for ice abundances (comparing with H2O) and comparing with the upper and lower bounds provided in Boogert et al. (2015) and with the well constrained narrow band of Rocha et al. (2024). We note that HCOOH and HCOO− are summed in establishing the observational abundances. Right panel: t-FA/c-FA gas phase ratios for the best performing model in linear scale. The gray area represents an approximated characteristic timescale of TMC-1 (Pratap et al. 1997).
Current usage metrics show cumulative count of Article Views (full-text article views including HTML views, PDF and ePub downloads, according to the available data) and Abstracts Views on Vision4Press platform.
Data correspond to usage on the plateform after 2015. The current usage metrics is available 48-96 hours after online publication and is updated daily on week days.
Initial download of the metrics may take a while.