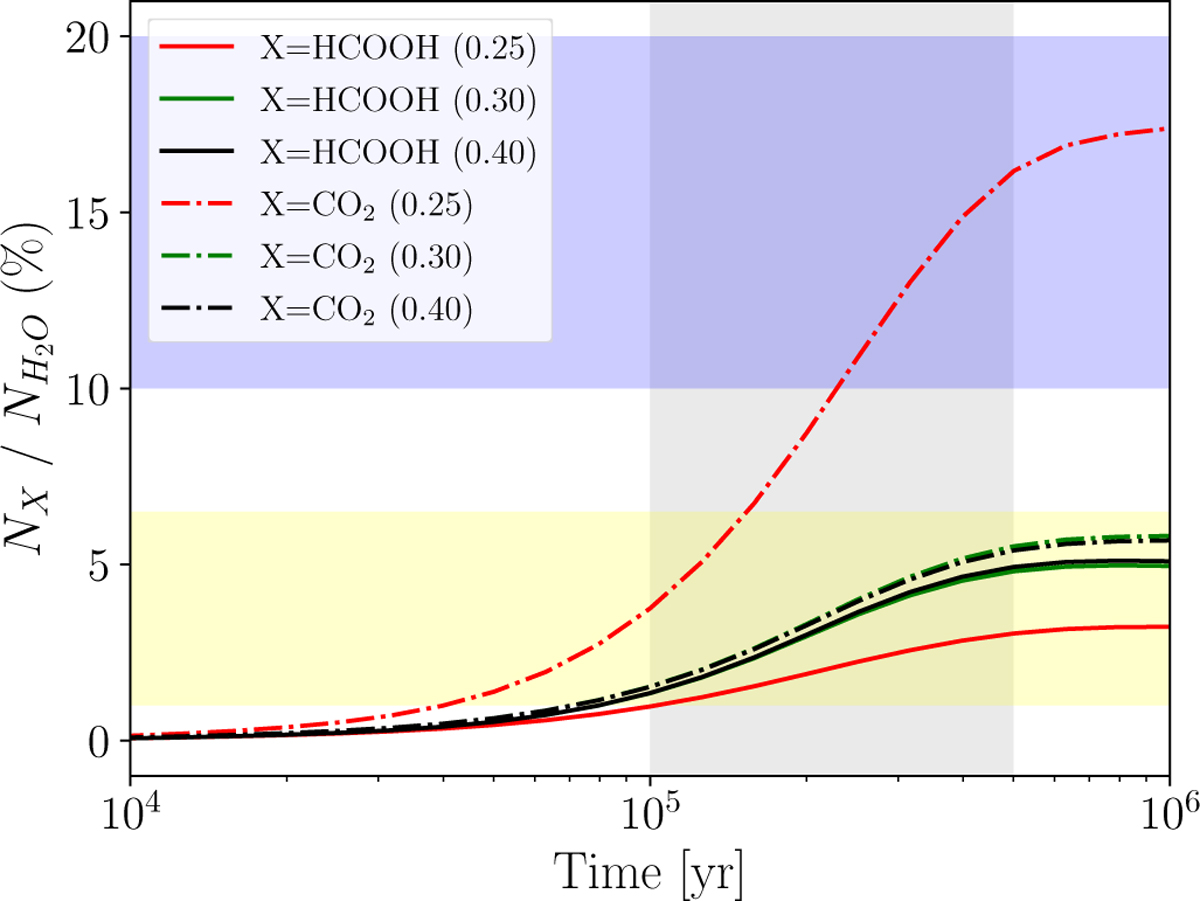
Fig. C.1
Download original image
Sensitivity analysis of our model to the oxygen atom diffusion energy for CO2 ice (dashed lines) and FA (suming c-t abundances). Values are represented with respect to H2O column density- The difussion Ediff energy is defined from the Ediff/Ebin parameter in our models. Ediff/Ebin is set to 0.25, 0.30 and 0.40 in those models. The pale blue zone represents the observationally constrained abundances of CO2 (Boogert et al. 2015; McClure et al. 2023) and the pale yellow zone represent the same for FA (Boogert et al. 2015; Rocha et al. 2024). We assume that FA and HCOO− abundances sum.
Current usage metrics show cumulative count of Article Views (full-text article views including HTML views, PDF and ePub downloads, according to the available data) and Abstracts Views on Vision4Press platform.
Data correspond to usage on the plateform after 2015. The current usage metrics is available 48-96 hours after online publication and is updated daily on week days.
Initial download of the metrics may take a while.