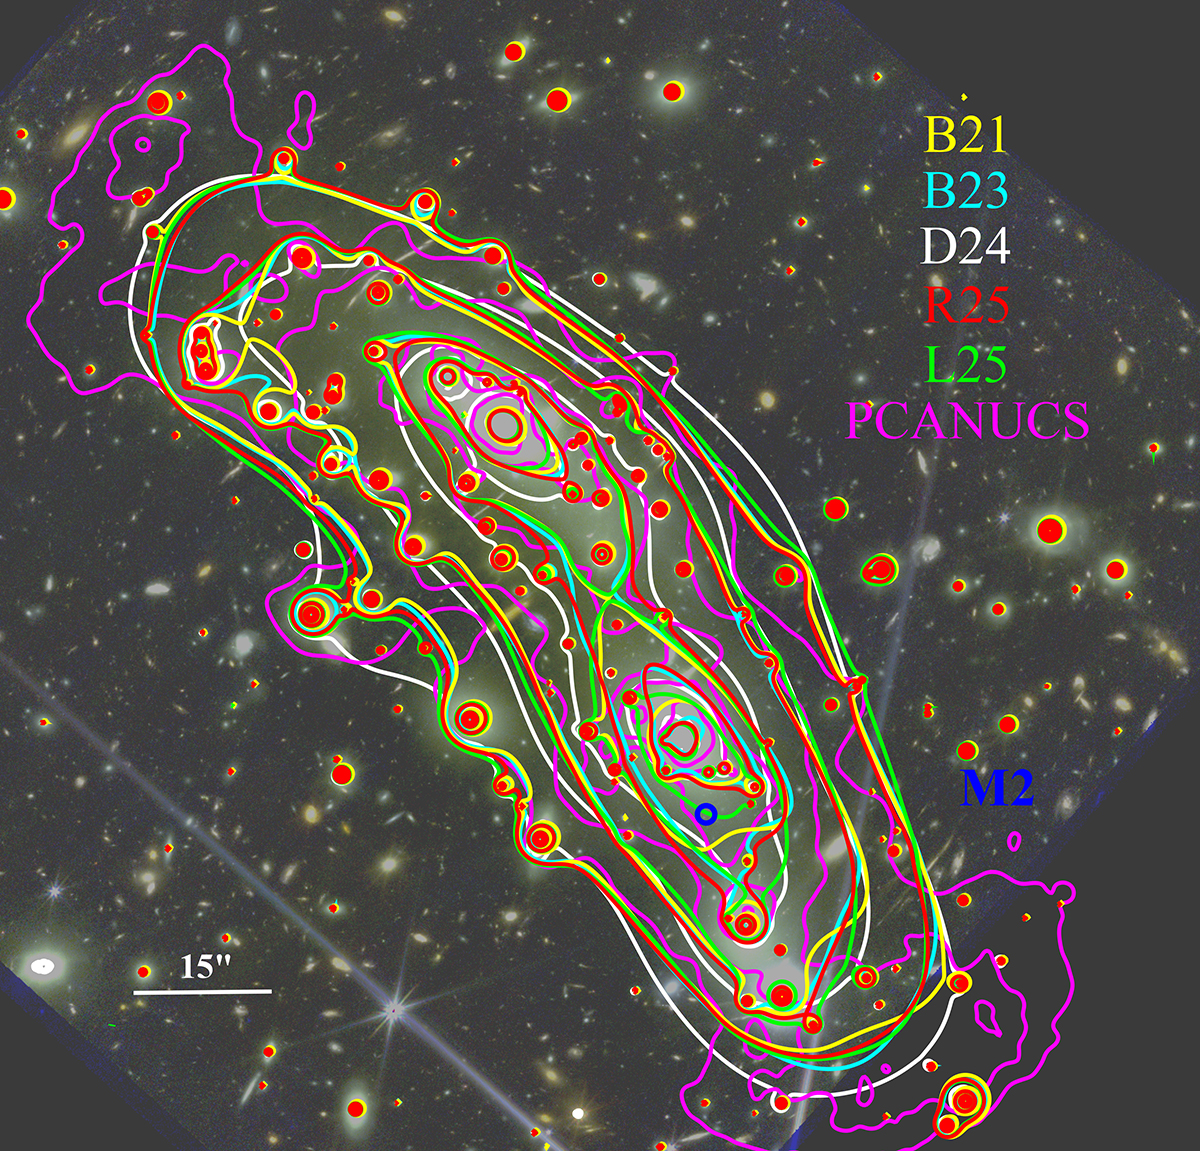
Fig. 2.
Download original image
Core of MACS 0416 from JWST data. We show the total convergence maps for all models: B21 in yellow; B23 in cyan; R25 in red; our updated GRALE model (PCANUCS) in magenta; and our updated LENSTOOL model (L25) in green. We also show the convergence map from Diego et al. (2024b) in white (D24). We show the location of M2 in blue.
Current usage metrics show cumulative count of Article Views (full-text article views including HTML views, PDF and ePub downloads, according to the available data) and Abstracts Views on Vision4Press platform.
Data correspond to usage on the plateform after 2015. The current usage metrics is available 48-96 hours after online publication and is updated daily on week days.
Initial download of the metrics may take a while.