Fig. 3.
Download original image
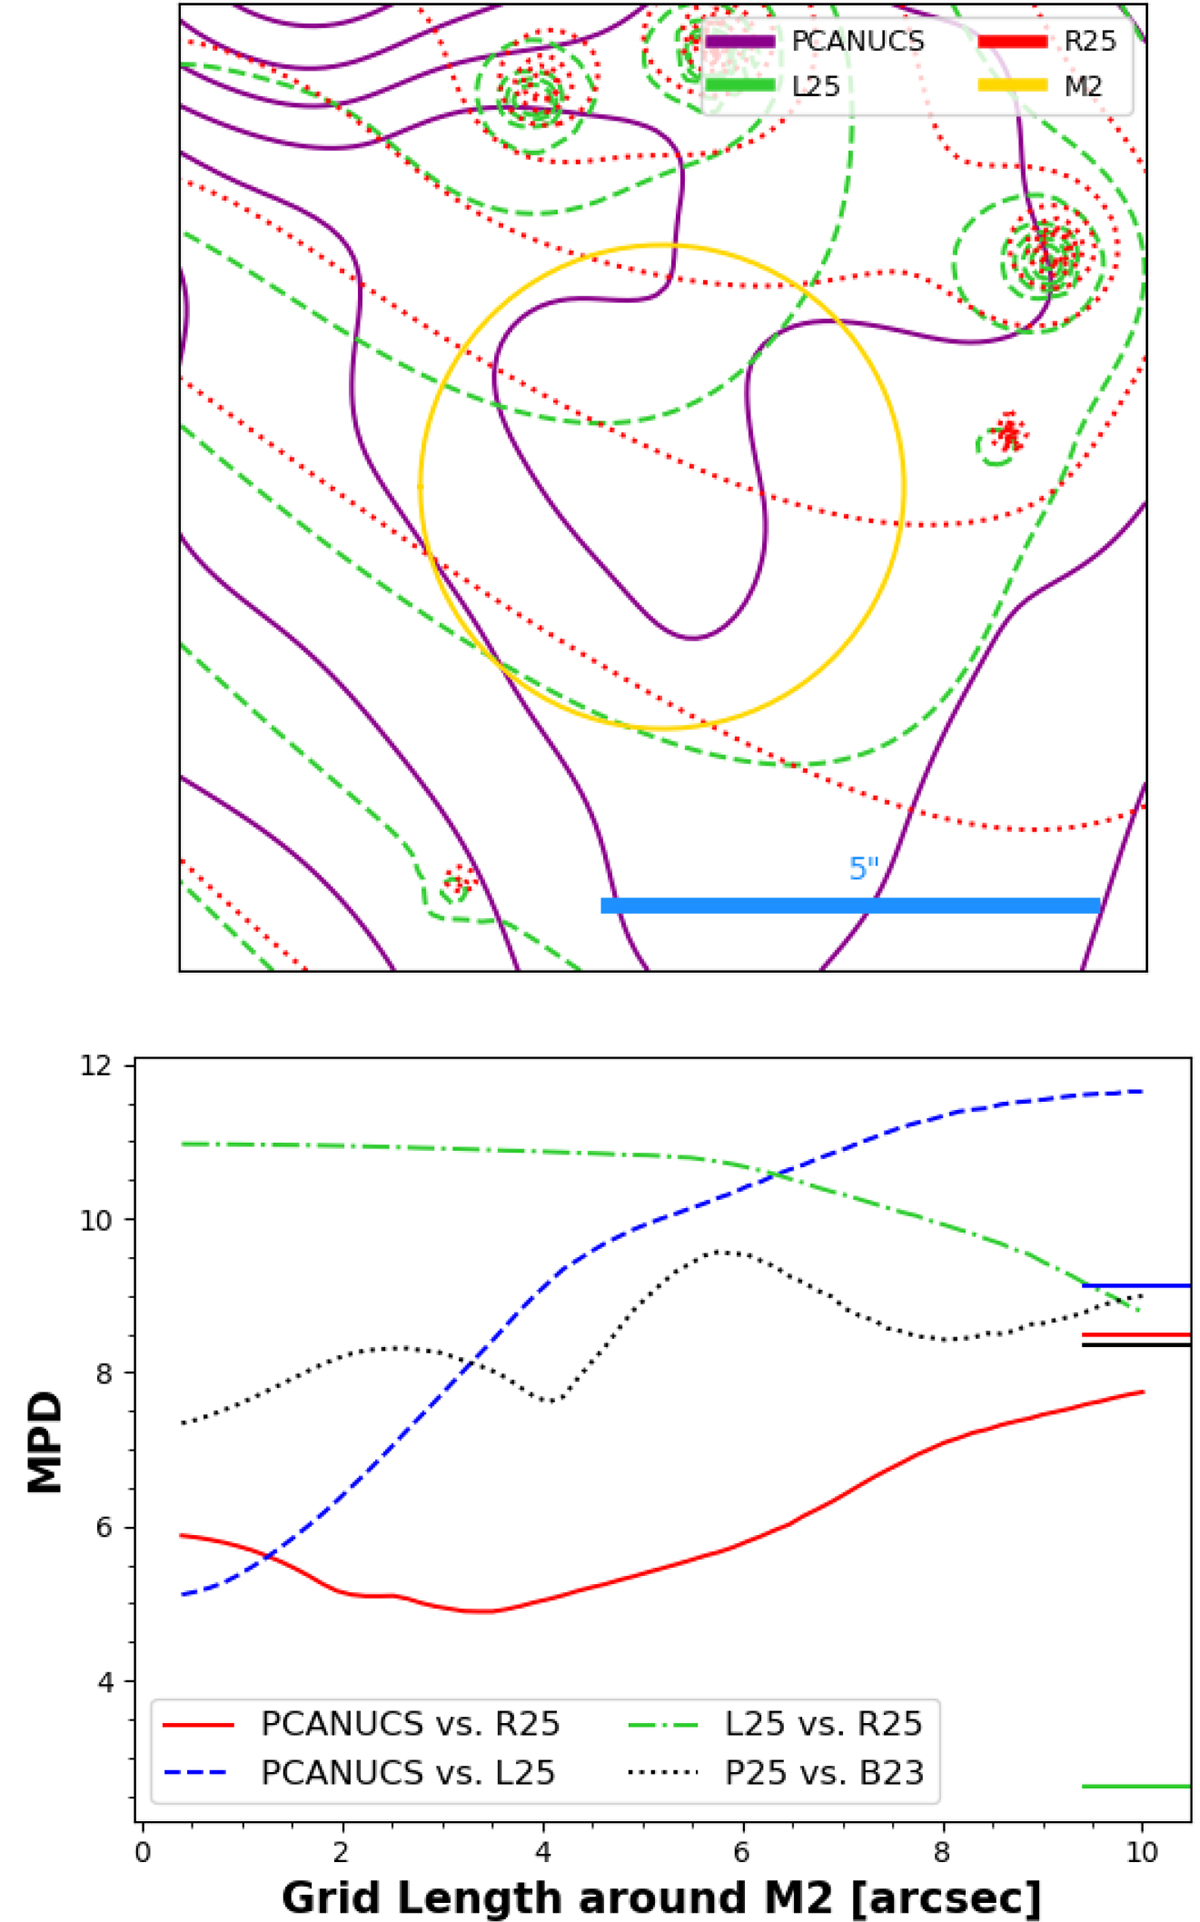
Top: Density contours in 10″ × 10″ area centred on peak of M2 substructure recovered at RA = 64.03071, Dec = –24.07974 in PCANUCS. Spacing between contours is Δlog10κ = 0.05. The three primary lens models discussed in this article using the 303 images reported by R25 are shown in solid purple (PCANUCS), dashed green (L25), and dotted red (R25). The solid yellow circle denotes M2 with radius of 2.5″ corresponding to its characteristic radius. Bottom: Median percent difference (MPD) between models as a function of the length of the grid comparison window centred at about M2. Comparisons among PCANUCS and R25 (solid red), L25 and R25 (dash-dotted green), and PCANUCS and L25 (dashed blue) are shown. To compare these with the earlier works, the comparison using 237 images between P25 and B23 (dotted black) is also shown. For the comparisons between GRALE and LENSTOOL models, the solid horizontal dashes on the right indicate the MPD over the whole cluster for PCANUCS and R25 (red), PCANUCS and L25 (blue), L25 and R25 (green), and P25 and B23 (black). We note that the apparent misalignment of the contours near the galaxy positions is a likely side effect of interpolation using models of varying resolution. These shifts are restricted to the pixel level and have a negligible effect on our results.
Current usage metrics show cumulative count of Article Views (full-text article views including HTML views, PDF and ePub downloads, according to the available data) and Abstracts Views on Vision4Press platform.
Data correspond to usage on the plateform after 2015. The current usage metrics is available 48-96 hours after online publication and is updated daily on week days.
Initial download of the metrics may take a while.