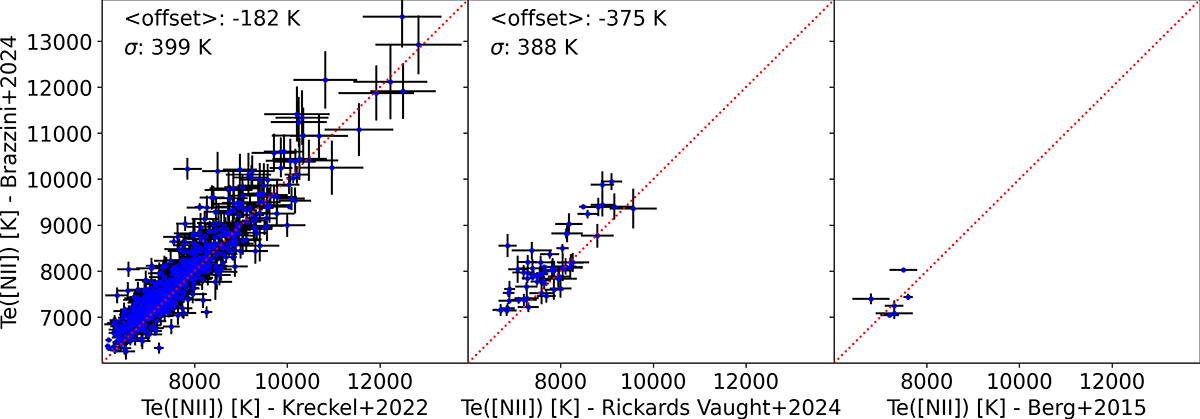
Fig. 1.
Download original image
Comparison of Te[N II] measurements used in this work (Brazzini et al. 2024) with three different sets of measurements from the literature. While the auroral line fits in Kreckel et al. (2022) (left) and Rickards Vaught et al. (2024) (center) are both based on the same underlying MUSE data set, different assumptions have been made in the SSP fitting and region boundaries. The Berg et al. (2015) measurements (right) are based on independent long-slit spectroscopy. As there are only five regions in common with Berg et al. (2015), no offset or scatter is calculated in comparison with this sample.
Current usage metrics show cumulative count of Article Views (full-text article views including HTML views, PDF and ePub downloads, according to the available data) and Abstracts Views on Vision4Press platform.
Data correspond to usage on the plateform after 2015. The current usage metrics is available 48-96 hours after online publication and is updated daily on week days.
Initial download of the metrics may take a while.