Fig. 2.
Download original image
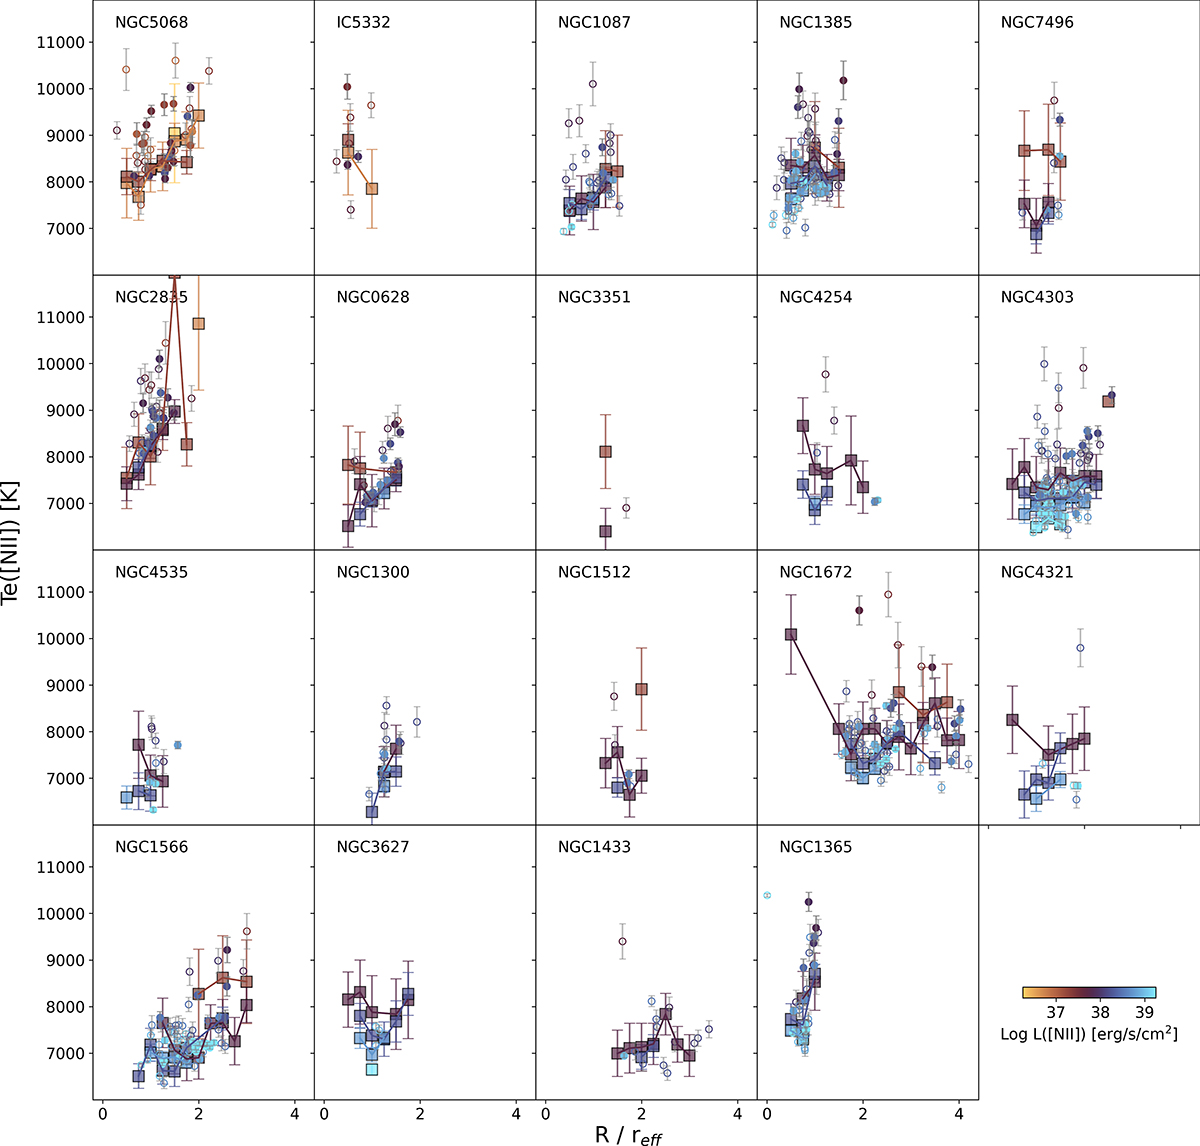
Te[N II] as a function of radius for all 19 galaxies. We compare individual H II regions (S/N > 3 open circles, S/N > 5 filled circles) with measurements from H II region stacks (squares and lines). Points are color-coded by their [N II] λ6583 Luminosity (L[[N II]]). Note: H II regions in NGC 4254 and NGC 4535 do not cover the full disk due to the AO notch filter. Galaxies are ordered from low (top-left) to high (bottom-right) stellar mass. All galaxies are shown with matched scales, so it is possible to directly compare the absolute values and slopes across the sample.
Current usage metrics show cumulative count of Article Views (full-text article views including HTML views, PDF and ePub downloads, according to the available data) and Abstracts Views on Vision4Press platform.
Data correspond to usage on the plateform after 2015. The current usage metrics is available 48-96 hours after online publication and is updated daily on week days.
Initial download of the metrics may take a while.