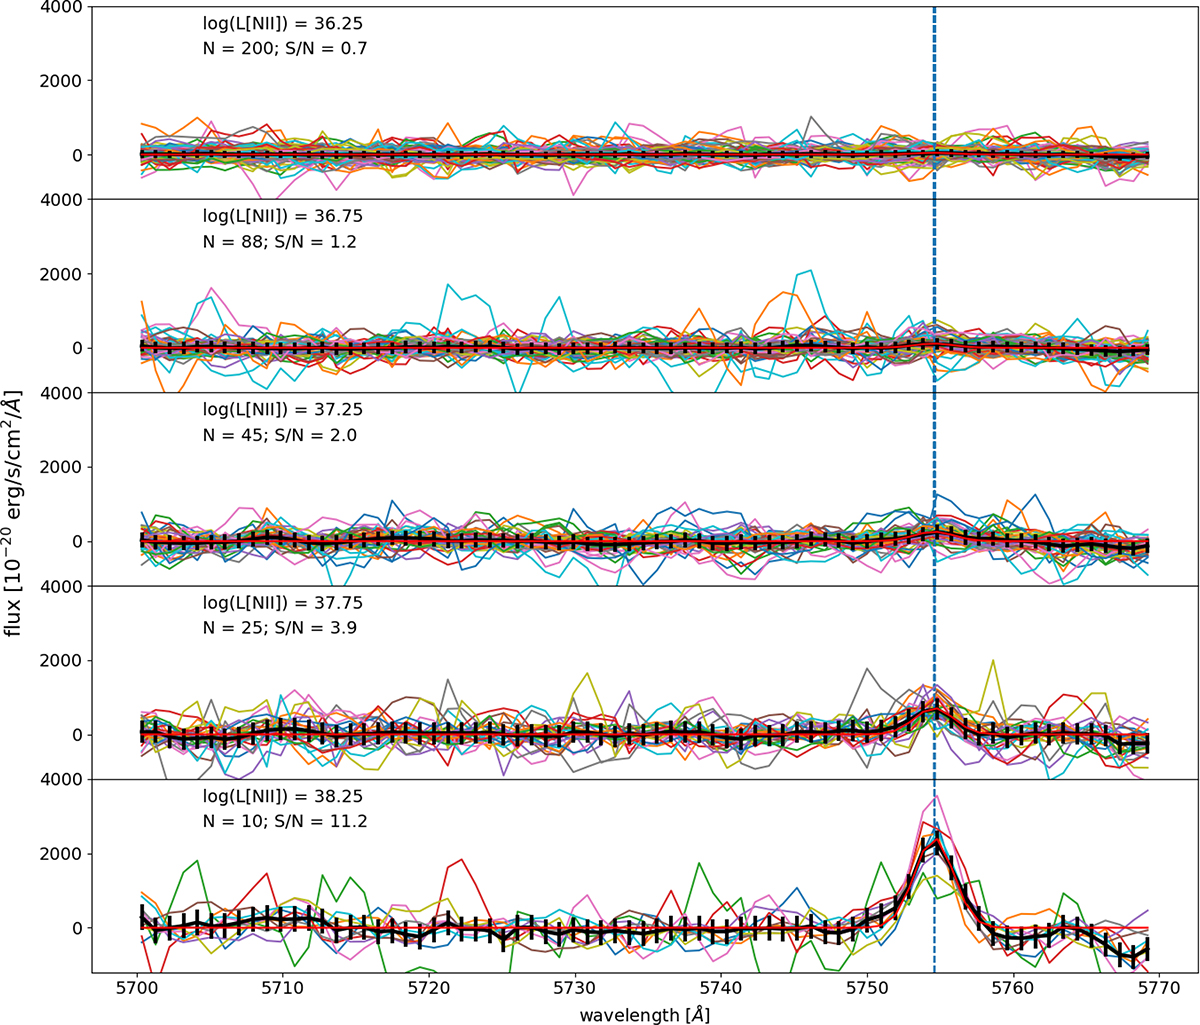
Fig. B.1.
Download original image
Example of the resulting stacked spectra in bins of log(L[N II]) = 0.5 at a radius of 1 reff within the galaxy NGC 628, with all spectra shifted to their rest wavelength based on their Hα velocity. Individual H II region spectra are shown in color, the mean stacked spectrum is shown in black, and the fit is shown in red. This wavelength range focuses on the [N II]λ5755 line, marked with a blue dashed line. The luminosity bin, number of individual H II regions included, and resulting S/N of the fit are shown in the upper left corner of each plot.
Current usage metrics show cumulative count of Article Views (full-text article views including HTML views, PDF and ePub downloads, according to the available data) and Abstracts Views on Vision4Press platform.
Data correspond to usage on the plateform after 2015. The current usage metrics is available 48-96 hours after online publication and is updated daily on week days.
Initial download of the metrics may take a while.