Fig. 1
Download original image
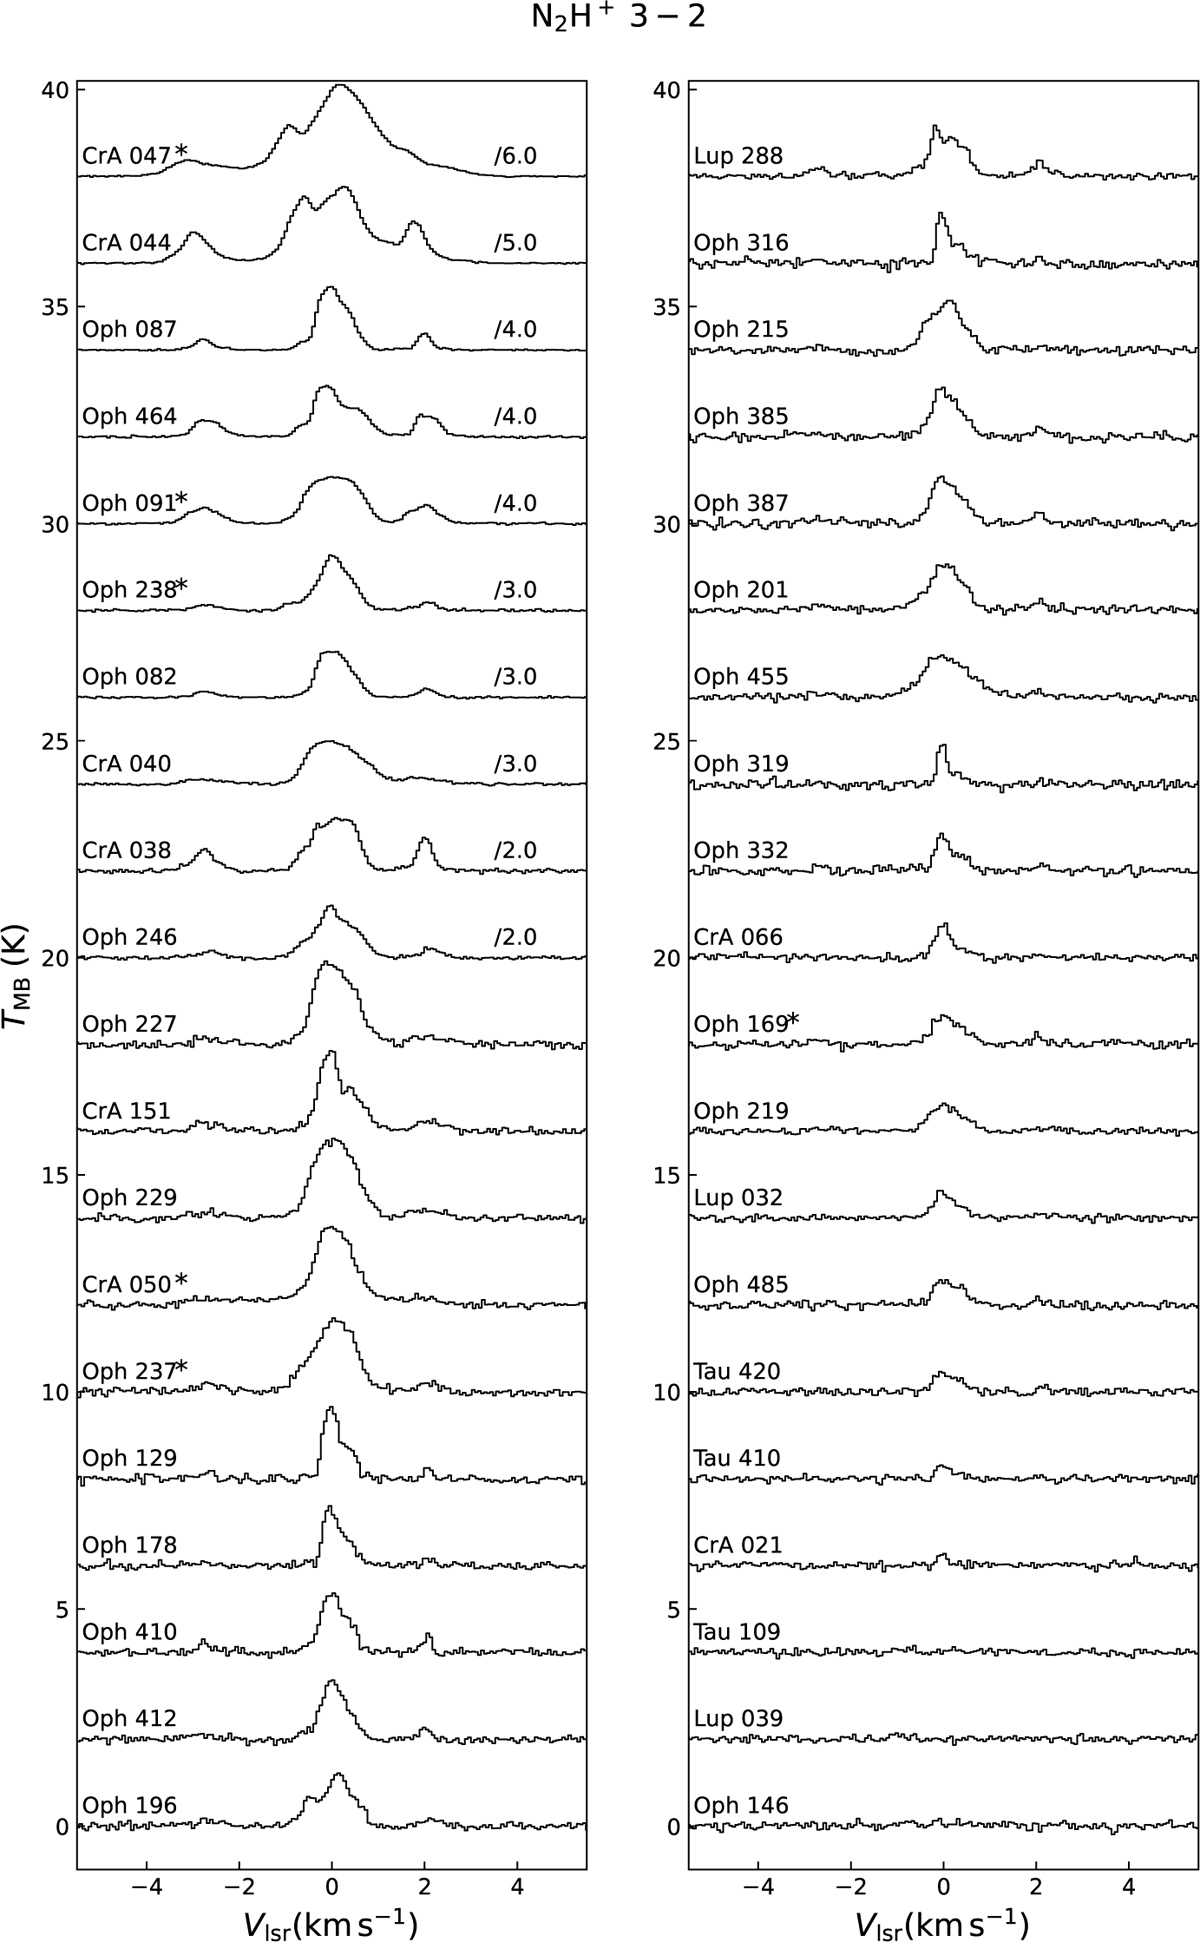
Spectra of N2H+ (3–2) toward the whole sample of pre-stellar core candidates in Table A.1. From top to bottom and then from left to right, the spectra are ordered in integrated intensity, with CRA 047 being the strongest. The spectra have also been displaced in intensity by multiples of 2 K and centered at 0 LSR velocity, for a comparison. Note that the spectra of the first ten objects have been divided by factors of between 6 and 2 (see labels) for clarity. Asterisks next to the names indicate the association with a YSO.
Current usage metrics show cumulative count of Article Views (full-text article views including HTML views, PDF and ePub downloads, according to the available data) and Abstracts Views on Vision4Press platform.
Data correspond to usage on the plateform after 2015. The current usage metrics is available 48-96 hours after online publication and is updated daily on week days.
Initial download of the metrics may take a while.