| Issue |
A&A
Volume 703, November 2025
|
|
|---|---|---|
| Article Number | A77 | |
| Number of page(s) | 14 | |
| Section | Interstellar and circumstellar matter | |
| DOI | https://doi.org/10.1051/0004-6361/202556026 | |
| Published online | 06 November 2025 | |
Hunting pre-stellar cores with APEX: Overview
1
Max-Planck-Institut für Extraterrestrische Physik,
Giessenbachstrasse 1,
85748
Garching,
Germany
2
European Southern Observatory,
Karl-Schwarzschild-Strasse 2,
85748
Garching,
Germany
3
Department of Physics,
PO Box 64,
00014
University of Helsinki,
Finland
4
Institute for Advanced Study, Kyushu University,
Japan
5
Department of Earth and Planetary Sciences, Faculty of Science, Kyushu University, Nishi-ku,
Fukuoka
819-0395,
Japan
6
Univ. Rennes, CNRS,
IPR (Institut de Physique de Rennes) – UMR 6251,
35000
Rennes,
France
7
Department of Space, Earth, and Environment, Chalmers University of Technology,
412 96
Gothenburg,
Sweden
,
8
Max-Planck-Institut für Radioastronomie,
Auf dem Hügel 69,
53121
Bonn,
Germany
★ Corresponding author: This email address is being protected from spambots. You need JavaScript enabled to view it.
Received:
19
June
2025
Accepted:
29
August
2025
Abstract
Context. Pre-stellar cores are centrally concentrated starless cores on the verge of star formation and they represent the initial conditions for star and planet formation. Pre-stellar cores host an active organic chemistry and isotopic fractionation, kept stored in thick icy mantles, that can be inherited by the future protoplanetary disks and planetesimals. It is therefore important to study pre-stellar cores, but this is difficult as they are short-lived, and thus rare. So far, only a few pre-stellar cores have been studied in detail, with special attention being paid to the prototypical pre-stellar core L1544 in the Taurus Molecular Cloud.
Aims. Our aim is to identify nearby (<200 pc) pre-stellar cores in an unbiased way, to build a sample that can then be studied in detail. This will also allow us to explore the effect of the environment on the chemical and physical structure of pre-stellar cores.
Methods. We first used the archival Herschel Gould Belt Survey data, selecting all those starless cores with central H2 number densities higher than or equal to 3×105 cm−3, the density of L1544 within the Herschel beam of 20″. The selected 40 (out of 1746) cores were then observed in N2H+ (3–2) and N2D+ (4–3) using the APEX antenna.
Results. Following a simple analysis, a total of 17 bona fide (i.e., with a deuterium fraction larger than 10%) pre-stellar cores have been identified. Another 16 objects can also be considered pre-stellar, as they are dynamically evolved starless cores, but their deuterium fractions is relatively low (<10%); thus, they deserve further scrutiny to unveil the source of the low deuteration. Of the remaining seven objects, six have been found to be associated with a young stellar object, and one (CrA 151) presents hints of a very young (or very low-luminosity) stellar object.
Conclusions. Dust continuum emission, together with spectroscopic observations of N2H+ (3–2) and N2D+ (4–3), is a powerful tool to identify pre-stellar cores in molecular clouds. Detailed modeling of the physical structure of the objects is now required to reconstruct the chemical composition as a function of radius. This work has provided a statistically significant sample of 33 pre-stellar cores, a crucial step in the understanding of the process of star and planet formation.
Key words: stars: formation / ISM: clouds / ISM: molecules
© The Authors 2025
 Open Access article, published by EDP Sciences, under the terms of the Creative Commons Attribution License (https://creativecommons.org/licenses/by/4.0), which permits unrestricted use, distribution, and reproduction in any medium, provided the original work is properly cited.
This article is published in open access under the Subscribe to Open model.
Open Access funding provided by Max Planck Society.
1 Introduction
Stellar systems are the product of the collapse of dense cores within interstellar molecular clouds (e.g., Benson & Myers 1989; Bergin & Tafalla 2007). It is therefore important to study dense cores, as the initial conditions for star and planet formation are to be found there, including all the ingredients participating in the spectacular chemical and physical evolution from interstellar clouds to planets such as our Earth. Particularly interesting are starless cores with centrally concentrated density profiles and central densities higher than 105 cm−3, which can become unstable against gravitational collapse (Keto & Caselli 2008). These cores are called “pre-stellar” as they are expected to contract and proceed toward star formation, while the less dense ones could be thermally supported and pulsating (such as B68; Alves et al. 2001; Lada et al. 2003), pressure-confined and unbound (such as the starless cores in the Pipe Nebula; Lada et al. 2008), or transient structures with evidence of expansion motions (as in the case of L1517B; Tafalla et al. 2004) or simply at an earlier stage of evolution (Tafalla & Santiago 2004)1.
Pre-stellar cores have clear temperature gradients, from outer edge values of around 10–13 K and central values of around 6–8 K (e.g., Crapsi et al. 2007; Pagani et al. 2007; Launhardt et al. 2013), well understood by radiative transfer models of externally illuminated Bonnor-Ebert (BE; Bonnor 1956; Ebert 1955) spheres (e.g., Evans et al. 2001; Zucconi et al. 2001; Gonçalves et al. 2004). The low temperatures and high densities favor the freeze-out of molecules, which becomes “catastrophic” in pre-stellar cores within the central few thousand astronomical units (Caselli et al. 1999, 2022; Bacmann et al. 2002; Redaelli et al. 2019; Pineda et al. 2022; Lin et al. 2023b). This is important, as it implies that just before star formation dust grains are enshrouded in thick icy mantles, where volatiles crucial for mineral evolution and the synthesis of prebiotic material (in particular water and organic molecules) are then delivered to the future protostellar disk. Indeed, large amounts of water (Caselli et al. 2012) and organics (e.g., Öberg et al. 2010; Bacmann et al. 2012; Cernicharo et al. 2021; Jiménez-Serra et al. 2016, 2021; McGuire et al. 2018; Scibelli & Shirley 2020; Punanova et al. 2022; Megías et al. 2023; Scibelli et al. 2024) are known to be present in these and similar environments, as was recently confirmed by the James Webb Space Telescope (JWST’s) sharp view of ice components along the line of sight of stars behind the Chamaeleon I dark molecular cloud (McClure et al. 2023).
A large amount of molecular freeze-out and low temperatures within pre-stellar cores also boost deuterium fractionation (Dalgarno & Lepp 1984; Roberts et al. 2003; Walmsley et al. 2004; Sipilä et al. 2010; Aikawa et al. 2012; Taquet et al. 2012), leading to deuterium fractions orders of magnitude larger than the cosmic D/H value (≃1.5×10⁻⁵; Moos et al. 2002). Thus, copious amounts of deuterium atoms and deuterated species such as DCO+, N2D+, DCN, and DNC as well as singly and multiply deuterated forms of ![Mathematical equation: $\[\mathrm{H}_{3}^{+}\]$](/articles/aa/full_html/2025/11/aa56026-25/aa56026-25-eq1.png) , NH3, H2CO, H2CS, c-C3H2, and CH3OH are produced (e.g., Caselli et al. 2002b, 2003; Lis et al. 2002; Bacmann et al. 2003; Vastel et al. 2004; Crapsi et al. 2005; Parise et al. 2011; Spezzano et al. 2013; Chantzos et al. 2018; Harju et al. 2017; Bizzocchi et al. 2014; Redaelli et al. 2019; Ambrose et al. 2021; Spezzano et al. 2022; Giers et al. 2022, 2023; Lin et al. 2023a). Large deuterium fractions of simple species are also measured toward protostellar objects, especially toward the young Class 0 sources still surrounded by the cold and dense envelope, part of the original pre-stellar core. For example, Emprechtinger et al. (2009) found N2H+ D fractions of ≥15% for the youngest objects and lower values (≃3%) at the Class 0-I borderline (see also Friesen et al. 2010a, 2013; Punanova et al. 2016; Chantzos et al. 2018; Giers et al. 2023; Mercimek et al. 2025). Closer to the protostar, within the so-called “hot corino”, where the dust temperature increases above the evaporation temperature of water (~100 K; e.g., Ceccarelli et al. 2007), complex organic molecules, and in particular methanol, also present significant D fractions (e.g., Parise et al. 2002, 2004; Manigand et al. 2020; Ferrer Asensio et al. 2023; Bunn et al. 2025). This can be explained if the evaporated ices are those formed during the pre-stellar phase, where the high atomic D/H ratio (due to the dissociative recombination of the deuterated forms of
, NH3, H2CO, H2CS, c-C3H2, and CH3OH are produced (e.g., Caselli et al. 2002b, 2003; Lis et al. 2002; Bacmann et al. 2003; Vastel et al. 2004; Crapsi et al. 2005; Parise et al. 2011; Spezzano et al. 2013; Chantzos et al. 2018; Harju et al. 2017; Bizzocchi et al. 2014; Redaelli et al. 2019; Ambrose et al. 2021; Spezzano et al. 2022; Giers et al. 2022, 2023; Lin et al. 2023a). Large deuterium fractions of simple species are also measured toward protostellar objects, especially toward the young Class 0 sources still surrounded by the cold and dense envelope, part of the original pre-stellar core. For example, Emprechtinger et al. (2009) found N2H+ D fractions of ≥15% for the youngest objects and lower values (≃3%) at the Class 0-I borderline (see also Friesen et al. 2010a, 2013; Punanova et al. 2016; Chantzos et al. 2018; Giers et al. 2023; Mercimek et al. 2025). Closer to the protostar, within the so-called “hot corino”, where the dust temperature increases above the evaporation temperature of water (~100 K; e.g., Ceccarelli et al. 2007), complex organic molecules, and in particular methanol, also present significant D fractions (e.g., Parise et al. 2002, 2004; Manigand et al. 2020; Ferrer Asensio et al. 2023; Bunn et al. 2025). This can be explained if the evaporated ices are those formed during the pre-stellar phase, where the high atomic D/H ratio (due to the dissociative recombination of the deuterated forms of ![Mathematical equation: $\[\mathrm{H}_{3}^{+}\]$](/articles/aa/full_html/2025/11/aa56026-25/aa56026-25-eq2.png) , Roberts et al. 2003; Walmsley et al. 2004) allows efficient surface deuteration of surface species, such as CO, producing deuterated organics, such as CH3OH (Tielens 1983; Caselli et al. 2002a; Taquet et al. 2012; Riedel et al. 2023). Lower D fractions of organics are measured at later stages of protostellar evolution (Bianchi et al. 2017), possibly due to gas-phase processes at high temperature, which tend to decrease the deuteration. However, pre-stellar core ices are at least partially maintained through the whole process of star and planet formation, as they are needed to explain the water D/H ratio in our oceans (about ten times higher than the cosmic D/H; Cleeves et al. 2014) and the large methanol D/H ratio measured in comet 67P/Churyumov-Gerasimenko (Drozdovskaya et al. 2021).
, Roberts et al. 2003; Walmsley et al. 2004) allows efficient surface deuteration of surface species, such as CO, producing deuterated organics, such as CH3OH (Tielens 1983; Caselli et al. 2002a; Taquet et al. 2012; Riedel et al. 2023). Lower D fractions of organics are measured at later stages of protostellar evolution (Bianchi et al. 2017), possibly due to gas-phase processes at high temperature, which tend to decrease the deuteration. However, pre-stellar core ices are at least partially maintained through the whole process of star and planet formation, as they are needed to explain the water D/H ratio in our oceans (about ten times higher than the cosmic D/H; Cleeves et al. 2014) and the large methanol D/H ratio measured in comet 67P/Churyumov-Gerasimenko (Drozdovskaya et al. 2021).
Despite the important role played by pre-stellar cores in sculpting the physical structure and chemical composition of stellar systems, only a few have been found and investigated with single dish telescopes (e.g., Crapsi et al. 2005; Pagani et al. 2005; Spezzano et al. 2020; Lin et al. 2023b,a) and only one has been studied extensively, including with interferometric observations: L1544 in the Taurus Molecular Cloud (e.g., Caselli et al. 1999, 2002b, 2019, 2022; Ohashi et al. 1999; Williams & Myers 1999; Spezzano et al. 2016, 2017, 2022; Redaelli et al. 2019, 2021, 2022). The reason for this is that prestellar cores are rare because their life expectancy is short, i.e. the passage from the pre- to proto-stellar phase is fast (between 1 and 10 free-fall times; André et al. 2014). For example, the life expectancy of L1544 is estimated to be less than 50 000 yr, based on the free-fall time relative to the central structure, called the “kernel”, revealed by the Atacama Large Millimeter and sub-millimeter Array (ALMA; Caselli et al. 2019) and evolutionary models of magnetized cores (e.g., Tassis & Mouschovias 2007). Therefore, we decided to start a new hunt for pre-stellar cores in nearby molecular clouds, using the unbiased view of the Herschel Space Observatory, as provided by the Herschel Gould Belt Survey (HGBS; André et al. 2010) legacy program, and our detailed knowledge of the prototypical pre-stellar core L1544. With this new unbiased method, we identified 40 pre-stellar core candidates (Sect. 2.1), which have then been observed in highexcitation N2H+ and N2D+ lines with the Atacama Pathfinder EXperiment (APEX) to assess their pre-stellar nature (Sect. 2.2). In Section 3 we present the data, show spectra, provide a preliminary estimate of the D/H ratio and physical conditions of the gas traced by the selected lines, and finally identify the bona fide prestellar cores. A discussion follows in Sect. 4 and conclusions in Sect. 5. The aim of this paper is to present the project overview, introduce the sample, and show the APEX data. Detailed studies of the physical and chemical structure of individual pre-stellar cores are presented in Redaelli et al. (2025), Spezzano et al. (2025), and future papers.
2 Observations
2.1 The sample selection
As was mentioned in the introduction, our definition of prestellar cores is more restrictive than the one given by André et al. (2000), as we consider pre-stellar all dense starless cores that are gravitationally bound (as in André et al. 2000) and that have centrally concentrated density profiles with central densities higher than 105 cm−3, and that are thus thermally supercritical (Keto & Caselli 2008) and likely contracting, as in the case of the prototypical pre-stellar core L1544 (Keto et al. 2015).
Our initial sample included all nearby (distance <200 pc) starless cores identified in the Herschel Gould Belt Survey Archive (HGBSA; André et al. 2010, and the publicly available catalogs2). The total number of starless cores (including starless, prestellar and prestelllar candidates source in the HGBS catalogs) is 1746 in the Ophiuchus, Corona Australis, Taurus, and Lupus Molecular Clouds. These catalogs provide the identified core properties including their number densities (see e.g., Könyves et al. 2015). The method of deriving the core number density was the following. First, the peak column density (N) was derived from graybody spectral energy distribution (SED) fits to the peak flux densities in a common beam of 36″ at the four Herschel wavelengths (160, 250, 350, and 500 μm). The beam-averaged peak number density (n) was derived from the peak column density (N) and the radius (R) of the cores assuming a Gaussian spherical distribution, ![Mathematical equation: $\[n{=}\sqrt{4 ln 2 / \pi} \times N / R\]$](/articles/aa/full_html/2025/11/aa56026-25/aa56026-25-eq3.png) , where R is the core radius measured at the 20″ angular resolution. We then computed the number density of L1544 within the central 20" (the Herschel resolution), and found
, where R is the core radius measured at the 20″ angular resolution. We then computed the number density of L1544 within the central 20" (the Herschel resolution), and found ![Mathematical equation: $\[n\left(\mathrm{H}_{2}\right)_{20^{\prime \prime}}^{\mathrm{L} 1544}{=}3 {\times} 10^{5} \mathrm{~cm}^{-3}\]$](/articles/aa/full_html/2025/11/aa56026-25/aa56026-25-eq4.png) . The next step was to extract from the HGBSA sample those objects with
. The next step was to extract from the HGBSA sample those objects with ![Mathematical equation: $\[n\left(\mathrm{H}_{2}\right)_{20^{\prime \prime}} \geq n\left(\mathrm{H}_{2}\right)_{20^{\prime \prime}}^{\mathrm{L} 1544}\]$](/articles/aa/full_html/2025/11/aa56026-25/aa56026-25-eq5.png) . Only 44 cores fulfilled this criterion. After excluding four cores having protostars in their immediate vicinity, the final sample consists of 40 pre-stellar core candidates.
. Only 44 cores fulfilled this criterion. After excluding four cores having protostars in their immediate vicinity, the final sample consists of 40 pre-stellar core candidates.
Table A.1 presents the whole sample of 40 pre-stellar core candidates, selected for observations with the Atacama Pathfinder EXperiment (APEX; see Sect. 2.2): the HGBSA name is in Column 1, J2000 equatorial coordinates are in Columns 2 and 3, Column 4 lists the H2 column density derived from the Herschel data at the resolution of the 500 μm surface brightness maps (![Mathematical equation: $\[36^{\prime \prime}_\cdot3\]$](/articles/aa/full_html/2025/11/aa56026-25/aa56026-25-eq6.png) ), the observing setup is specified in Column 5 (see notes for the frequency ranges and receivers used), Column 6 shows other names used in the literature, with corresponding references reported in the notes to the table. We immediately note that 6 of the 40 pre-stellar core candidates (marked by an asterisk in Table A.1) are associated with known very young stellar objects (YSOs). In addition, one of the cores (CrA 044) has an unidentified mid-infrared source (detected at 8 and 24 μm with Spitzer) within its radius. However, higher angular resolution spectroscopic observations are needed to confirm if this source is embedded in the CrA 044 core and we consider CrA 044 starless in this study. The core properties derived from the HGBS data are listed in Appendix B. There, we also give criteria for association with a YSO.
), the observing setup is specified in Column 5 (see notes for the frequency ranges and receivers used), Column 6 shows other names used in the literature, with corresponding references reported in the notes to the table. We immediately note that 6 of the 40 pre-stellar core candidates (marked by an asterisk in Table A.1) are associated with known very young stellar objects (YSOs). In addition, one of the cores (CrA 044) has an unidentified mid-infrared source (detected at 8 and 24 μm with Spitzer) within its radius. However, higher angular resolution spectroscopic observations are needed to confirm if this source is embedded in the CrA 044 core and we consider CrA 044 starless in this study. The core properties derived from the HGBS data are listed in Appendix B. There, we also give criteria for association with a YSO.
Observed molecule, transition, frequency, critical density (ncrit), half power beam width (HPBW), main beam efficiency (ηMB), velocity resolution (Δv), and root mean square noise (rms).
2.2 APEX observations
APEX observations were carried out in 2022 and 2023 under the projects O-0110.F-9310A-2022, M-0110.F-9501C-2022, and M-0110.F-9501C-2023 (PI: Caselli). In the initial survey, the center positions of all 40 cores of the original HGBS sample were observed using the SEPIA345 receiver (Meledin et al. 2022) using frequency setups that cover the N2H+ (3–2) and N2D+ (4–3) lines. These were single-point position-switched observations. The OFF positions were selected 5 arcmin away from the target in a direction that appeared free of dense gas judging from Herschel far-infrared maps. The tuning range of SEPIA345 is 272–376 GHz. The receiver has two 8 GHz wide IF outputs (upper and lower sidebands) per polarization, separated by 8 GHz. These were recorded with altogether 8 Fast Fourier Transform Spectrometer (FFTS) units with a bandwidth of 4 GHz each. The FFTS units were configured so that the adjacent spectrometer bands overlap by approximately 100 MHz, so the total bandwidth per sideband and polarization is 7.9 GHz. Each 4 GHz spectrometer band was resolved into 65536 spectral channels of 61.03 kHz in width. Using two tunings, the approximate frequency ranges covered by SEPIA are 272–280 GHz, 288–296 GHz, and 304–312 GHz (the range 288–296 GHz was observed twice). In addition to N2H+ (3–2) and N2D+ (4–3), for example the DCO+ (4–3), CS (6–5), and meta-ND3 (10−00) lines are included in these frequency ranges.
Subsequent ON-OFF observations toward 23 HGBS targets selected based on their N2H+ (3–2) and N2D+ (4–3) spectra were made using the dual channel nFLASH230/460 receiver tuned to measure the N2D+ (3–2), N2D+ (6–5), and N2H+ (5–4) lines. This setup was also used to observe the archetypical prestellar core L1544 in Taurus (e.g., Caselli et al. 2019). In the analysis of this source, we also use the N2H+ (3–2) spectrum observed with the IRAM 30 m telescope by Redaelli et al. (2019). The nFLASH230 receiver is tunable between 196 and 281 GHz, and its IF outputs (LSB and USB) are 8 GHz wide when two polarizations are measured simultaneously. The tuning range of the nFLASH460 receiver is 378–508 GHz, and the IF bandwidth is 4 GHz. For both nFLASH receivers, the LSB and USB are separated by 8 GHz. With a single tuning, the nFLASH230/460 receivers covered the spectral ranges 224–232 GHz, 241–249 GHz, 462–466 GHz, and 475–479 GHz. In addition to N2D+ (3–2), N2D+ (6–5), and N2H+ (5–4) lines, these frequency ranges contain several other lines, for example, CN (N = 2–1), CS (5–4), and C17O (2 − 1).
In this overview paper, we focus the attention on the N2H+ and N2D+ lines (see Table 1), as these allow us to follow an analysis similar to the one carried out by Crapsi et al. (2005), although the higher J transitions considered here selectively trace material at densities higher than 105 cm−3, possibly including the kernel, the central flattened structure a few thousand astronomical units in size discovered in L1544 with ALMA (Caselli et al. 2019, 2022). All the other molecules and transitions detected in the receiver setups listed in Column 6 of Table A.1 will be presented in the papers focusing on individual sources (see first papers by Redaelli et al. 2025; Spezzano et al. 2025). Table 1 lists the N2H+ and N2D+ lines observed with APEX (Columns 1 and 2), the transition frequencies (Column 3, from the Cologne Database for Molecular Spectroscopy; Endres et al. 2016), the critical density of the transition (ncrit, Column 4), the receiver used (Column 5), the half power beam width (HPBW, Column 6), the main beam efficiency (Column 7), the velocity resolution (Column 8) and the root mean square (rms, Column 9). The critical densities of the observed transitions of N2H+ and N2D+ shown in Table 2 were estimated at 10 K, using the optically thin formula of Shirley (2015, Eq. (4)). This formula takes into account all collisionally induced transitions starting from the upper transition level of the emission line. The line frequencies were taken from Pagani et al. (2009), and the collisional (de-)excitation rate coefficients were adopted from Schöier et al. (2005) and Lique et al. (2015).
3 Results
3.1 Spectra
The whole sample of pre-stellar core candidates in Table A.1 has been observed in N2H+ (3–2) and N2D+ (4–3), while a selection of 23 objects has been observed in N2H+ (5–4), N2D+ (3–2) and(6–5). We focus here on the N2H+ (3–2) and N2D+ (4–3) lines, as they have very similar critical densities (larger than the threshold of 3×105 cm−3; see Sect. 2.1) and they can be observed with similar angular resolution (see Table 1), allowing for a more accurate determination of the deuterium fraction, assuming that they are tracing the same gas (see Section 4 for more details on this). The spectra of N2H+ (3–2) and N2D+ (4–3) toward the whole sample are shown in Figures 1 and 2, respectively. They are presented in order of decreasing N2H+ (3–2) line intensity. Note that the N2H+ (3–2) line is detected almost everywhere (37 out of 40 objects, i.e., in 93% of the sample). N2D+ (4–3) is detected in 27 objects (68% of the sample) and the intensity does not follow the N2H+ (3–2) trend, suggesting significant variations in the deuterium fraction among sources (see Sect. 3.2). The other lines, N2H+ (5–4), N2D+ (3–2), and N2D+ (6–5), observed in a subsample of 23 objects are displayed in Fig. C.1.
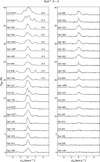 |
Fig. 1 Spectra of N2H+ (3–2) toward the whole sample of pre-stellar core candidates in Table A.1. From top to bottom and then from left to right, the spectra are ordered in integrated intensity, with CRA 047 being the strongest. The spectra have also been displaced in intensity by multiples of 2 K and centered at 0 LSR velocity, for a comparison. Note that the spectra of the first ten objects have been divided by factors of between 6 and 2 (see labels) for clarity. Asterisks next to the names indicate the association with a YSO. |
3.2 Constant excitation temperature analysis
3.2.1 Column density and deuterium fraction
The centrally concentrated density profiles of the pre-stellar core candidates in Table A.1 require a proper non-local thermodynamic equilibrium (non-LTE) analysis. This will be done in the individual papers such as those from Redaelli et al. (2025) and Spezzano et al. (2025), as a detailed physical structure of each core is needed. Here we consider a simple constant excitation temperature analysis to provide N2H+ and N2D+ column densities, based on N2H+ (3–2) and N2D+ (4–3), respectively, and the D/H ratio in all the objects showing N2D+ (4–3). As was already mentioned, these two lines have very similar critical densities and have been observed with almost identical angular resolutions (Table 1), providing a reliable measurement of the deuterium fraction in the core inner regions with densities above ≃105 cm−3.
Gaussian fits taking into account the hyperfine structure (hfs) of the two lines were carried out using the CLASS/GILDAS software3 and the results are reported in Tables D.1 and D.2. The objects in these tables have been ordered as those in Figures 1 and 2, i.e., in order of decreasing N2H+ (3–2) integrated intensity. The tables present the hfs fit output (Columns 2–5: J(TMB) × τ, where J(TMB) is the equivalent Rayleigh-Jeans main beam temperatures, and τ is the total optical depth, i.e., the sum of the optical depth of all the hyperfines, the centroid velocity, vLSR, the intrinsic line width, FWHM, and the total optical depth), the excitation temperature Tex (Column 6), derived from the radiative transfer equation and the information from Columns 2 and 5, the total column density N (Column 7). If the line is optically thin, or if the error on τ is larger than τ/3, the excitation temperature must be assumed. Column 8 of Tables D.1 and D.2 shows the column density using the assumed Tex. In general, if Tex can be measured for the N2H+ (3–2) line but not for the N2D+ (4–3) line, we used the N2H+ (3–2) excitation temperature for the calculation of the N2D+ column density. If Tex cannot be measured at all, then we adopt for both lines Tex = 5 K, the typical value for similarly faint objects. Column 9 shows the D/H ratio (RD) calculated by simply taking the ratio of the N2D+ and N2H+ column densities. RD values range from about 0.016±0.001 (Oph 082, see Table D.1) to 4±2 (CrA 151).
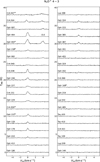 |
Fig. 2 Spectra of N2D+ (4–3) toward the whole sample of pre-stellar core candidates in Table A.1. The spectra follow the same order as in Fig. 1. The spectra have also been displaced in intensity by multiples of 2 K and centered at 0 LSR velocity, to allow for a comparison. Note that the spectrum of Oph 464 has been divided by a factor of 3 (see label) for clarity. |
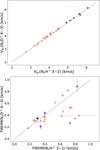 |
Fig. 3 Comparison of centroid velocities (vLSR) and line widths (FWHM) of the N2D+ (4–3) and N2H+ (3–2) lines. The different colors represent different molecular cloud complexes: Corona Australis (blue), Ophiuchus (red), Lupus (black). The stars show the cores associated with YSOs. The 1:1 correlation line is shown in dashed black. |
3.2.2 Correlations
Figure 3 compares the centroid velocities (vLSR) and the line widths (FWHM) of N2D+ (4–3) and N2H+ (3–2), showing a good correlation, especially in vLSR. This suggests that these two lines trace similar gas. The larger FWHM found in N2H+ (3–2) for some of the objects could be due to the larger volume occupied by N2H+, tracing the more turbulent motions or accretion flows in the outer regions of the core. However, higher-angular-resolution observations and mapping are needed to shed light on this difference. The cores associated with YSOs do not stand out in these figures, once again showing that the physical properties of the original pre-stellar core have not been significantly modified.
Figure 4 shows the N2H+ deuterium fraction (RD ≡ N(N2D+)/N(N2H+)) as a function of the H2 column density, N(H2), obtained from Herschel data (see Table A.1). The values range from ≃0.02 for core Oph 082 to ≃4 for core CrA 151, with a mean of 0.49±0.09. However, there is no obvious correlation between the two quantities, although higher column densities should imply higher volume densities, and thus larger deuterium fractions at the low dust temperatures reported in Table A.1. It is important to note that these values (derived from a constant excitation temperature analysis) are highly uncertain as non-LTE effects play a crucial role in the correct measurement of column densities in pre-stellar cores. This is clearly shown in Redaelli et al. (2025) and Spezzano et al. (2025). For example, CrA 151 has been studied in detail by Redaelli et al. (2025), who found RD ≃ 0.5 (instead of our 4±2, see Table D.1), while in Oph 464 Spezzano et al. (2025) found RD ≃ 0.4 (instead of 0.24±0.03, Table D.1). A detailed discussion on the discrepancies between the two methods to deduce column densities and D fractions can be found in the two papers. The missing trend between RD and N(H2) in Fig. 4 may then be due to the assumption of constant excitation temperature and results are expected to change once non-LTE analysis will be carried out for all cores. Figure 4 is, however, still useful for our overview study and for comparison with previous work (see next section).
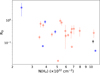 |
Fig. 4 N2H+ deuterium fraction (RD ≡ N(N2D+)/N(N2H+) column density ratio) obtained from the N2D+ (4–3) and N2H+ (3–2) lines using constant excitation temperature analysis, as a function of H2 column density, N(H2), from Herschel data. The different colors represent different molecular cloud complexes: Corona Australis (blue), Ophiuchus (red), Lupus (black). The stars show the cores associated with YSOs. |
4 Discussion
Using a similar (constant excitation temperature) analysis, Crapsi et al. (2005) defined as pre-stellar all dense starless cores with a deuterium fraction larger than 10%. If we adopt the same criterion, and with the caveats described in the previous section, we see from Tables D.1 and D.2 and Fig. 4 that 20 out of the 26 cores with RD values (77% of the sample) can be defined as prestellar. Among these, however, Oph 237, Oph 169, and perhaps CrA 151 (see Redaelli et al. 2025) are associated with a YSO. Therefore, we conclude that 17 of the studied objects are bona fide pre-stellar cores. This sample will be studied in detail with planned interferometric observations. The other starless cores with deuterium fractions of less than 10% are also interesting and deserve future scrutiny. The reason for this is that their high central densities derived from the Herschel data imply dynamically evolved structures either on the verge of protostar formation or hosting very young protostars, so the low deuterium fractions may point to different chemical evolution possibly linked to different environmental conditions.
It is not surprising that six (and possibly seven, if CrA 151 will be confirmed protostellar; see Redaelli et al. 2025) of the 40 Herschel-selected cores have been found associated with YSOs. The transition from pre-stellar to protostellar is expected to be fast, with very young protostellar objects still being surrounded by the cold and dense envelopes part of the original pre-stellar cores. In fact, four of the six cores associated with YSOs (Oph 091, Oph 169, Oph 237, and Oph 238), have RD between 0.07 and 0.3, so they do not show systematically lower deuterium fraction values as is expected in case of warm dense gas. This implies that the associated protostar is very young or has a very low luminosity and has not significantly modified the physical conditions of the surrounding dense envelope traced by N2H+ (3–2) and N2D+ (4–3) with APEX4. Crapsi et al. (2005) also included in their list of pre-stellar cores an object, L1521F (Crapsi et al. 2004), which was soon after found to harbor a very low-luminosity object (or VeLLO; Bourke et al. 2005). We stress that the D fraction measured with N2H+, a molecule produced in the gas phase, is particularly sensitive to the local kinetic temperature (Tkin), as proton-deuteron exchange reactions such as ![Mathematical equation: $\[\mathrm{H}_{3}^{+}\]$](/articles/aa/full_html/2025/11/aa56026-25/aa56026-25-eq7.png) + HD ⇌ H2D+ + H2 start to proceed from right to left when Tkin ≥ 30 K (Watson 1973), quickly dropping the abundance of N2D+ (formed from the reaction of N2 with
+ HD ⇌ H2D+ + H2 start to proceed from right to left when Tkin ≥ 30 K (Watson 1973), quickly dropping the abundance of N2D+ (formed from the reaction of N2 with ![Mathematical equation: $\[\mathrm{H}_{3}^{+}\]$](/articles/aa/full_html/2025/11/aa56026-25/aa56026-25-eq8.png) deuterated isotopologs). Only two cores in our sample associated with YSOs (Cra 047 and CrA 050) have no detection of N2D+ lines, suggesting the presence of a warm (Tkin > 30 K) envelope possibly due to central heating or to dynamical and chemical evolution in warmer environments where deuterium fractionation is not favored. This will be checked in future studies.
deuterated isotopologs). Only two cores in our sample associated with YSOs (Cra 047 and CrA 050) have no detection of N2D+ lines, suggesting the presence of a warm (Tkin > 30 K) envelope possibly due to central heating or to dynamical and chemical evolution in warmer environments where deuterium fractionation is not favored. This will be checked in future studies.
The high central volume densities obtained from Herschel data (all above the threshold value of 3×105 cm−3; see Section 2.1 and Table B.1), can be compared with the volume densities obtained using line ratios for those cores where multiple lines have been observed in N2H+ and N2D+. Figures 5 and 6 present volume density (nH2) vs. kinetic temperature (Tkin) curves for the N2H+ (5–4)/(3-2) and N2D+ (4–3)/(3–2) line flux ratios, respectively, obtained with the RADEX code (van der Tak et al. 2007). The line flux ratios for each individual source are marked by labeled gray curves, which are full if Tkin < Tdust and dashed if Tkin > Tdust, where Tdust is the dust temperature from Herschel (see Table A.1). It is interesting to note that some objects need a Tkin significantly lower than Tdust to have central densities above the selection threshold of 3×105 cm−3 (see Section 2.1). This is the case for CrA 038 (Figs. 5 and 6), an object with a deuterium fraction below 0.1 (Table D.1) and three bona fide pre-stellar cores (Cra 066, Oph 316, Oph 385; Fig. 6). Kinetic temperatures lower than dust temperatures are expected in case of external heating. For example, an enhanced interstellar radiation field could heat the dust in the outer core envelope, so that the Herschel dust temperature measurement toward the core center will be skewed to values at least a few kelvin higher than the central temperature, as has also been found in other studies (e.g., Choudhury et al. 2021, in the Ophiuchus Molecular Cloud). More detailed analyses will be carried out in future papers focused on these objects to investigate this point. In particular, interferometric observations of NH3 will be required to measure the central gas temperature and more accurately reconstruct the temperature profiles across the cores, following procedures similar to those described in Crapsi et al. (2007) and Lin et al. (2023b).
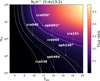 |
Fig. 5 H2 volume density (nH2) versus kinetic temperature (Tkin) traced by the N2H+ (5–4)/(3–2) line flux ratio and based on the RADEX non-LTE code (van der Tak et al. 2007). The objects where this flux ratio was possible to measure are indicated in the figure by the labeled gray curves. The curves are dashed if Tkin > Tdust and full if Tkin < Tdust, where Tdust is the dust temperature measured with Herschel (see Table A.1). |
5 Conclusions
Pre-stellar cores represent the initial conditions in the process of star and planet formation, but they are difficult to find as they are short-lived. With the aim of increasing the number of known pre-stellar cores in nearby (<200 pc) clouds and study their properties as a function of environment, we used archival Herschel data on starless cores from the Gould Belt Survey (André et al. 2010) to identify objects with central densities higher than or equal to 3×105 cm−3 (the density of the prototypical pre-stellar core L1544 within the central 20″; e.g., Caselli et al. 2019). We found 40 cores (out of 1746), which we then observed with APEX in order to inquire about their nature. This was done by scrutinizing the line profile of high density tracers with a high spectral resolution (61 kHz) and high sensitivity (20–60 mK) and by measuring the deuterium fraction using N2H+ (3–2) and N2D+ (4–3) lines. Of the 40 dense cores, 17 can be considered bona fide pre-stellar cores, as they have deuterium fractions larger than 10% (following the original definition of Crapsi et al. 2005). Six cores (or seven if also CrA 151 is included; see Redaelli et al. 2025) of the 40 originally selected cores with Herschel host a very young (and/or very low-luminosity) stellar object that has not yet significantly modified the chemical composition of its envelope, as the corresponding deuterium fractions measured with APEX are relatively large (between 7 and 30%), except for CrA 047 and CrA 050, not detected in N2D+ lines. The other pre-stellar cores (17 objects) with deuterium fractions of less than 10% require further investigation, in order for us to understand what causes the lower level of deuteration in such dynamically evolved structures.
Here we have presented an overview of our findings, following a simple analysis. A more detailed analysis of each individual core is in progress and the first results can be found in Spezzano et al. (2025) and Redaelli et al. (2025). Interferometric observations, in particular with ALMA, similar to those described in Caselli et al. (1999, 2022) are also planned. ALMA observations are crucial to study the structure of the central regions, the so-called kernel (Caselli et al. 2019), its connection to the rest of the core and its dynamical evolution toward the formation of the YSO and the protoplanetary disk. The kernel chemical and physical structure is required to put quantitative constraints on simulations of star and planet formation.
This work demonstrates that a combination of dust continuum emission and high-density-tracer spectral line data presents a powerful tool to identify pre-stellar cores, a crucial step in the formation of stellar systems. Detailed studies of pre-stellar cores are needed not just for understanding the process of star and planet formation by setting the initial conditions, but also for quantifying the chemical inheritance from clouds to planets and our astrochemical origins.
Acknowledgements
The authors acknowledge our referee, Jes Jørgensen, for careful reading of the paper and important suggestions. We also thank the Max Planck Society for the support.
Appendix A Prestellar core candidates observed with APEX
Pre-stellar core candidates observed with APEX.
Appendix B Core Physical Properties derived from the HGBS data
Physical properties derived from the Herschel Gould Belt Survey (HGBS) data are listed in Table B.1. The cores associated with YSOs are listed in Table B.2. This table gives the observed core radius from the HGBS catalogs, the angular distance to the nearest known YSO (provided that this is shorter than 70″), and the number of YSOs within the core radius. The search for YSOs was performed using the SIMBAD Astronomical Database5. A core was considered starless if no YSO is found within its radius. We also inspected the mid-infrared surface brightness maps of the 40 targets extracted from the Spitzer and WISE6 data archives7. The starless cores, with the single exception of CrA 044, did not show compact mid-infrared emission.
Core properties derived from Herschel Gould Belt Survey data.
Targets associated with YSOs.
Appendix C Spectra of N2D+ (3-2), N2H+ (5-4), and N2D+ (6-5)
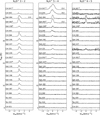 |
Fig. C.1 Spectra of N2D+ (3-2), N2H+ (5-4), and N2D+ (6-5) toward a subsample of 23 pre-stellar core candidates. From top to bottom, the spectra follow the same order as in Fig. 1. The spectra have also been displaced in intensity by 2 K and centered at 0 LSR velocity, to allow for a comparison. Note that some spectra have been divided or multiplied by factors of 2 to 5 (see labels) for clarity. |
Appendix D Hyperfine fit results for the cores in Table A.1
References
- Aikawa, Y., Wakelam, V., Hersant, F., Garrod, R. T., & Herbst, E. 2012, ApJ, 760, 40 [NASA ADS] [CrossRef] [Google Scholar]
- Alves, J. F., Lada, C. J., & Lada, E. A. 2001, Nature, 409, 159 [NASA ADS] [CrossRef] [Google Scholar]
- Ambrose, H. E., Shirley, Y. L., & Scibelli, S. 2021, MNRAS, 501, 347 [Google Scholar]
- André, P., Ward-Thompson, D., & Barsony, M. 1993, ApJ, 406, 122 [Google Scholar]
- André, P., Ward-Thompson, D., & Barsony, M. 2000, in Protostars and Planets IV, eds. V. Mannings, A. P. Boss, & S. S. Russell, 59 [Google Scholar]
- André, P., Men’shchikov, A., Bontemps, S., et al. 2010, A&A, 518, L102 [NASA ADS] [CrossRef] [EDP Sciences] [Google Scholar]
- André, P., Di Francesco, J., Ward-Thompson, D., et al. 2014, in Protostars and Planets VI, eds. H. Beuther, R. S. Klessen, C. P. Dullemond, & T. Henning, 27 [Google Scholar]
- Bacmann, A., Lefloch, B., Ceccarelli, C., et al. 2002, A&A, 389, L6 [NASA ADS] [CrossRef] [EDP Sciences] [Google Scholar]
- Bacmann, A., Lefloch, B., Ceccarelli, C., et al. 2003, ApJ, 585, L55 [NASA ADS] [CrossRef] [Google Scholar]
- Bacmann, A., Taquet, V., Faure, A., Kahane, C., & Ceccarelli, C. 2012, A&A, 541, L12 [NASA ADS] [CrossRef] [EDP Sciences] [Google Scholar]
- Benedettini, M., Pezzuto, S., Schisano, E., et al. 2018, A&A, 619, A52 [NASA ADS] [CrossRef] [EDP Sciences] [Google Scholar]
- Benson, P. J., & Myers, P. C. 1989, ApJS, 71, 89 [Google Scholar]
- Bergin, E. A., & Tafalla, M. 2007, ARA&A, 45, 339 [Google Scholar]
- Bianchi, E., Codella, C., Ceccarelli, C., et al. 2017, MNRAS, 467, 3011 [NASA ADS] [CrossRef] [Google Scholar]
- Bizzocchi, L., Caselli, P., Spezzano, S., & Leonardo, E. 2014, A&A, 569, A27 [NASA ADS] [CrossRef] [EDP Sciences] [Google Scholar]
- Bonnor, W. B. 1956, MNRAS, 116, 351 [NASA ADS] [CrossRef] [Google Scholar]
- Bourke, T. L., Crapsi, A., Myers, P. C., et al. 2005, ApJ, 633, L129 [Google Scholar]
- Bresnahan, D., Ward-Thompson, D., Kirk, J. M., et al. 2018, A&A, 615, A125 [NASA ADS] [CrossRef] [EDP Sciences] [Google Scholar]
- Bunn, H. A., Spezzano, S., Coudert, L. H., et al. 2025, ApJ, 980, L13 [Google Scholar]
- Caselli, P., Walmsley, C. M., Tafalla, M., Dore, L., & Myers, P. C. 1999, ApJ, 523, L165 [Google Scholar]
- Caselli, P., Stantcheva, T., Shalabiea, O., Shematovich, V. I., & Herbst, E. 2002a, Planet. Space Sci., 50, 1257 [Google Scholar]
- Caselli, P., Walmsley, C. M., Zucconi, A., et al. 2002b, ApJ, 565, 344 [Google Scholar]
- Caselli, P., van der Tak, F. F. S., Ceccarelli, C., & Bacmann, A. 2003, A&A, 403, L37 [CrossRef] [EDP Sciences] [Google Scholar]
- Caselli, P., Keto, E., Bergin, E. A., et al. 2012, ApJ, 759, L37 [Google Scholar]
- Caselli, P., Pineda, J. E., Zhao, B., et al. 2019, ApJ, 874, 89 [NASA ADS] [CrossRef] [Google Scholar]
- Caselli, P., Pineda, J. E., Sipilä, O., et al. 2022, ApJ, 929, 13 [NASA ADS] [CrossRef] [Google Scholar]
- Ceccarelli, C., Caselli, P., Herbst, E., Tielens, A. G. G. M., & Caux, E. 2007, in Protostars and Planets V, eds. B. Reipurth, D. Jewitt, & K. Keil, 47 [Google Scholar]
- Cernicharo, J., Agúndez, M., Cabezas, C., et al. 2021, A&A, 649, L15 [EDP Sciences] [Google Scholar]
- Chantzos, J., Spezzano, S., Caselli, P., et al. 2018, ApJ, 863, 126 [CrossRef] [Google Scholar]
- Chen, H. H.-H., Pineda, J. E., Goodman, A. A., et al. 2019, ApJ, 877, 93 [Google Scholar]
- Chini, R., Kämpgen, K., Reipurth, B., et al. 2003, A&A, 409, 235 [NASA ADS] [CrossRef] [EDP Sciences] [Google Scholar]
- Choudhury, S., Pineda, J. E., Caselli, P., et al. 2021, A&A, 648, A114 [NASA ADS] [CrossRef] [EDP Sciences] [Google Scholar]
- Cleeves, L. I., Bergin, E. A., Alexander, C. M. O. D., et al. 2014, Science, 345, 1590 [NASA ADS] [CrossRef] [Google Scholar]
- Crapsi, A., Caselli, P., Walmsley, C. M., et al. 2004, A&A, 420, 957 [NASA ADS] [CrossRef] [EDP Sciences] [Google Scholar]
- Crapsi, A., Caselli, P., Walmsley, C. M., et al. 2005, ApJ, 619, 379 [Google Scholar]
- Crapsi, A., Caselli, P., Walmsley, M. C., & Tafalla, M. 2007, A&A, 470, 221 [NASA ADS] [CrossRef] [EDP Sciences] [Google Scholar]
- Dalgarno, A., & Lepp, S. 1984, ApJ, 287, L47 [NASA ADS] [CrossRef] [Google Scholar]
- Di Francesco, J., André, P., & Myers, P. C. 2004, ApJ, 617, 425 [NASA ADS] [CrossRef] [Google Scholar]
- Di Francesco, J., Johnstone, D., Kirk, H., MacKenzie, T., & Ledwosinska, E. 2008, ApJS, 175, 277 [Google Scholar]
- Drozdovskaya, M. N., Schroeder I. I. R. H. G., Rubin, M., et al. 2021, MNRAS, 500, 4901 [Google Scholar]
- Ebert, R. 1955, ZAp, 37, 217 [Google Scholar]
- Eden, D. J., Liu, T., Kim, K.-T., et al. 2019, MNRAS, 485, 2895 [NASA ADS] [CrossRef] [Google Scholar]
- Emprechtinger, M., Caselli, P., Volgenau, N. H., Stutzki, J., & Wiedner, M. C. 2009, A&A, 493, 89 [NASA ADS] [CrossRef] [EDP Sciences] [Google Scholar]
- Endres, C. P., Schlemmer, S., Schilke, P., Stutzki, J., & Müller, H. S. P. 2016, J. Mol. Spectrosc., 327, 95 [NASA ADS] [CrossRef] [Google Scholar]
- Evans, Neal J., I., Rawlings, J. M. C., Shirley, Y. L., & Mundy, L. G. 2001, ApJ, 557, 193 [NASA ADS] [CrossRef] [Google Scholar]
- Ferrer Asensio, J., Spezzano, S., Coudert, L. H., et al. 2023, A&A, 670, A177 [NASA ADS] [CrossRef] [EDP Sciences] [Google Scholar]
- Friesen, R. K., Di Francesco, J., Shirley, Y. L., & Myers, P. C. 2009, ApJ, 697, 1457 [Google Scholar]
- Friesen, R. K., Di Francesco, J., Myers, P. C., et al. 2010a, ApJ, 718, 666 [NASA ADS] [CrossRef] [Google Scholar]
- Friesen, R. K., Di Francesco, J., Shimajiri, Y., & Takakuwa, S. 2010b, ApJ, 708, 1002 [Google Scholar]
- Friesen, R. K., Kirk, H. M., & Shirley, Y. L. 2013, ApJ, 765, 59 [NASA ADS] [CrossRef] [Google Scholar]
- Gaczkowski, B., Preibisch, T., Stanke, T., et al. 2015, A&A, 584, A36 [NASA ADS] [CrossRef] [EDP Sciences] [Google Scholar]
- Giers, K., Spezzano, S., Alves, F., et al. 2022, A&A, 664, A119 [NASA ADS] [CrossRef] [EDP Sciences] [Google Scholar]
- Giers, K., Spezzano, S., Caselli, P., et al. 2023, A&A, 676, A78 [NASA ADS] [CrossRef] [EDP Sciences] [Google Scholar]
- Gonçalves, J., Galli, D., & Walmsley, M. 2004, A&A, 415, 617 [NASA ADS] [CrossRef] [EDP Sciences] [Google Scholar]
- Groppi, C. E., Hunter, T. R., Blundell, R., & Sandell, G. 2007, ApJ, 670, 489 [CrossRef] [Google Scholar]
- Haas, M., Heymann, F., Domke, I., et al. 2008, A&A, 488, 987 [NASA ADS] [CrossRef] [EDP Sciences] [Google Scholar]
- Hardegree-Ullman, E., Harju, J., Juvela, M., et al. 2013, ApJ, 763, 45 [Google Scholar]
- Harju, J., Daniel, F., Sipilä, O., et al. 2017, A&A, 600, A61 [NASA ADS] [CrossRef] [EDP Sciences] [Google Scholar]
- Jiménez-Serra, I., Vasyunin, A. I., Caselli, P., et al. 2016, ApJ, 830, L6 [Google Scholar]
- Jiménez-Serra, I., Vasyunin, A. I., Spezzano, S., et al. 2021, ApJ, 917, 44 [CrossRef] [Google Scholar]
- Kamazaki, T., Nakamura, F., Kawabe, R., et al. 2019, ApJ, 871, 86 [CrossRef] [Google Scholar]
- Kerr, R., Kirk, H., Di Francesco, J., et al. 2019, ApJ, 874, 147 [NASA ADS] [CrossRef] [Google Scholar]
- Keto, E., & Caselli, P. 2008, ApJ, 683, 238 [Google Scholar]
- Keto, E., Caselli, P., & Rawlings, J. 2015, MNRAS, 446, 3731 [NASA ADS] [CrossRef] [Google Scholar]
- Kirk, H., Dunham, M. M., Di Francesco, J., et al. 2017, ApJ, 838, 114 [NASA ADS] [CrossRef] [Google Scholar]
- Könyves, V., André, P., Men’shchikov, A., et al. 2015, A&A, 584, A91 [Google Scholar]
- Lada, C. J., Bergin, E. A., Alves, J. F., & Huard, T. L. 2003, ApJ, 586, 286 [NASA ADS] [CrossRef] [Google Scholar]
- Lada, C. J., Muench, A. A., Rathborne, J., Alves, J. F., & Lombardi, M. 2008, ApJ, 672, 410 [Google Scholar]
- Ladjelate, B., André, P., Könyves, V., et al. 2020, A&A, 638, A74 [NASA ADS] [CrossRef] [EDP Sciences] [Google Scholar]
- Launhardt, R., Stutz, A. M., Schmiedeke, A., et al. 2013, A&A, 551, A98 [NASA ADS] [CrossRef] [EDP Sciences] [Google Scholar]
- Lin, Y., Spezzano, S., & Caselli, P. 2023a, A&A, 669, L6 [NASA ADS] [CrossRef] [EDP Sciences] [Google Scholar]
- Lin, Y., Spezzano, S., Pineda, J. E., et al. 2023b, A&A, 680, A43 [NASA ADS] [CrossRef] [EDP Sciences] [Google Scholar]
- Lique, F., Daniel, F., Pagani, L., & Feautrier, N. 2015, MNRAS, 446, 1245 [NASA ADS] [CrossRef] [Google Scholar]
- Lis, D. C., Roueff, E., Gerin, M., et al. 2002, ApJ, 571, L55 [Google Scholar]
- Manigand, S., Jørgensen, J. K., Calcutt, H., et al. 2020, A&A, 635, A48 [NASA ADS] [CrossRef] [EDP Sciences] [Google Scholar]
- Marsh, K. A., Kirk, J. M., André, P., et al. 2016, MNRAS, 459, 342 [Google Scholar]
- McClure, M. K., Rocha, W. R. M., Pontoppidan, K. M., et al. 2023, Nat. Astron., 7, 431 [NASA ADS] [CrossRef] [Google Scholar]
- McGuire, B. A., Burkhardt, A. M., Kalenskii, S., et al. 2018, Science, 359, 202 [Google Scholar]
- Megías, A., Jiménez-Serra, I., Martín-Pintado, J., et al. 2023, MNRAS, 519, 1601 [Google Scholar]
- Meledin, D., Lapkin, I., Fredrixon, M., et al. 2022, A&A, 668, A2 [NASA ADS] [CrossRef] [EDP Sciences] [Google Scholar]
- Mercimek, S., Codella, C., Podio, L., et al. 2025, arXiv e-prints [arXiv:2502.18675] [Google Scholar]
- Moos, H. W., Sembach, K. R., Vidal-Madjar, A., et al. 2002, ApJS, 140, 3 [Google Scholar]
- Motte, F., Andre, P., & Neri, R. 1998, A&A, 336, 150 [NASA ADS] [Google Scholar]
- Nutter, D. J., Ward-Thompson, D., & André, P. 2005, MNRAS, 357, 975 [CrossRef] [Google Scholar]
- Öberg, K. I., Bottinelli, S., Jørgensen, J. K., & van Dishoeck, E. F. 2010, ApJ, 716, 825 [Google Scholar]
- Ohashi, N., Lee, S. W., Wilner, D. J., & Hayashi, M. 1999, ApJ, 518, L41 [Google Scholar]
- Pagani, L., Pardo, J. R., Apponi, A. J., Bacmann, A., & Cabrit, S. 2005, A&A, 429, 181 [NASA ADS] [CrossRef] [EDP Sciences] [Google Scholar]
- Pagani, L., Bacmann, A., Cabrit, S., & Vastel, C. 2007, A&A, 467, 179 [NASA ADS] [CrossRef] [EDP Sciences] [Google Scholar]
- Pagani, L., Daniel, F., & Dubernet, M. L. 2009, A&A, 494, 719 [NASA ADS] [CrossRef] [EDP Sciences] [Google Scholar]
- Parise, B., Ceccarelli, C., Tielens, A. G. G. M., et al. 2002, A&A, 393, L49 [NASA ADS] [CrossRef] [EDP Sciences] [Google Scholar]
- Parise, B., Castets, A., Herbst, E., et al. 2004, A&A, 416, 159 [NASA ADS] [CrossRef] [EDP Sciences] [Google Scholar]
- Parise, B., Belloche, A., Du, F., Güsten, R., & Menten, K. M. 2011, A&A, 526, A31 [NASA ADS] [CrossRef] [EDP Sciences] [Google Scholar]
- Pattle, K., Ward-Thompson, D., Kirk, J. M., et al. 2015, MNRAS, 450, 1094 [NASA ADS] [CrossRef] [Google Scholar]
- Pineda, J. E., Harju, J., Caselli, P., et al. 2022, AJ, 163, 294 [NASA ADS] [CrossRef] [Google Scholar]
- Punanova, A., Caselli, P., Pon, A., Belloche, A., & André, P. 2016, A&A, 587, A118 [NASA ADS] [CrossRef] [EDP Sciences] [Google Scholar]
- Punanova, A., Vasyunin, A., Caselli, P., et al. 2022, ApJ, 927, 213 [CrossRef] [Google Scholar]
- Redaelli, E., Bizzocchi, L., Caselli, P., et al. 2019, A&A, 629, A15 [NASA ADS] [CrossRef] [EDP Sciences] [Google Scholar]
- Redaelli, E., Sipilä, O., Padovani, M., et al. 2021, A&A, 656, A109 [NASA ADS] [CrossRef] [EDP Sciences] [Google Scholar]
- Redaelli, E., Chacón-Tanarro, A., Caselli, P., et al. 2022, ApJ, 941, 168 [NASA ADS] [CrossRef] [Google Scholar]
- Redaelli, E., Spezzano, S., Caselli, P., et al. 2025, A&A, 696, A171 [NASA ADS] [CrossRef] [EDP Sciences] [Google Scholar]
- Riedel, W., Sipilä, O., Redaelli, E., et al. 2023, A&A, 680, A87 [NASA ADS] [CrossRef] [EDP Sciences] [Google Scholar]
- Roberts, H., Herbst, E., & Millar, T. J. 2003, ApJ, 591, L41 [CrossRef] [Google Scholar]
- Schöier, F. L., van der Tak, F. F. S., van Dishoeck, E. F., & Black, J. H. 2005, A&A, 432, 369 [Google Scholar]
- Scibelli, S., & Shirley, Y. 2020, ApJ, 891, 73 [NASA ADS] [CrossRef] [Google Scholar]
- Scibelli, S., Shirley, Y., Megías, A., & Jiménez-Serra, I. 2024, MNRAS, 533, 4104 [Google Scholar]
- Shirley, Y. L. 2015, PASP, 127, 299 [Google Scholar]
- Sipilä, O., Hugo, E., Harju, J., et al. 2010, A&A, 509, A98 [Google Scholar]
- Spezzano, S., Brünken, S., Schilke, P., et al. 2013, ApJ, 769, L19 [Google Scholar]
- Spezzano, S., Bizzocchi, L., Caselli, P., Harju, J., & Brünken, S. 2016, A&A, 592, L11 [NASA ADS] [CrossRef] [EDP Sciences] [Google Scholar]
- Spezzano, S., Caselli, P., Bizzocchi, L., Giuliano, B. M., & Lattanzi, V. 2017, A&A, 606, A82 [NASA ADS] [CrossRef] [EDP Sciences] [Google Scholar]
- Spezzano, S., Caselli, P., Pineda, J. E., et al. 2020, A&A, 643, A60 [NASA ADS] [CrossRef] [EDP Sciences] [Google Scholar]
- Spezzano, S., Sipilä, O., Caselli, P., et al. 2022, A&A, 661, A111 [NASA ADS] [CrossRef] [EDP Sciences] [Google Scholar]
- Spezzano, S., Redaelli, E., Caselli, P., et al. 2025, A&A, 694, A27 [NASA ADS] [CrossRef] [EDP Sciences] [Google Scholar]
- Stanke, T., Smith, M. D., Gredel, R., & Khanzadyan, T. 2006, A&A, 447, 609 [NASA ADS] [CrossRef] [EDP Sciences] [Google Scholar]
- Tafalla, M., & Santiago, J. 2004, A&A, 414, L53 [NASA ADS] [CrossRef] [EDP Sciences] [Google Scholar]
- Tafalla, M., Myers, P. C., Caselli, P., & Walmsley, C. M. 2004, Ap&SS, 292, 347 [Google Scholar]
- Taquet, V., Ceccarelli, C., & Kahane, C. 2012, ApJ, 748, L3 [Google Scholar]
- Tassis, K., & Mouschovias, T. C. 2007, ApJ, 660, 388 [NASA ADS] [CrossRef] [Google Scholar]
- Tielens, A. G. G. M. 1983, A&A, 119, 177 [NASA ADS] [Google Scholar]
- van der Tak, F. F. S., Black, J. H., Schöier, F. L., Jansen, D. J., & van Dishoeck, E. F. 2007, A&A, 468, 627 [NASA ADS] [CrossRef] [EDP Sciences] [Google Scholar]
- Vastel, C., Phillips, T. G., & Yoshida, H. 2004, ApJ, 606, L127 [Google Scholar]
- Walmsley, C. M., Flower, D. R., & Pineau des Forêts, G. 2004, A&A, 418, 1035 [NASA ADS] [CrossRef] [EDP Sciences] [Google Scholar]
- Watson, W. D. 1973, ApJ, 181, L129 [NASA ADS] [CrossRef] [Google Scholar]
- Williams, J. P., & Myers, P. C. 1999, ApJ, 518, L37 [Google Scholar]
- Yonekura, Y., Mizuno, N., Saito, H., et al. 1999, PASJ, 51, 911 [Google Scholar]
- Zucconi, A., Walmsley, C. M., & Galli, D. 2001, A&A, 376, 650 [NASA ADS] [CrossRef] [EDP Sciences] [Google Scholar]
We note that our definition of pre-stellar core is more restrictive than the one given by André et al. (2000), as they consider pre-stellar all dense cores that are gravitationally bound.
The APEX beam at these frequencies is about 20″ (see Table 1), or ~3000 au at the distance of the selected targets.
The Wide-field Infrared Survey Explorer
All Tables
Observed molecule, transition, frequency, critical density (ncrit), half power beam width (HPBW), main beam efficiency (ηMB), velocity resolution (Δv), and root mean square noise (rms).
All Figures
|
Fig. 1 Spectra of N2H+ (3–2) toward the whole sample of pre-stellar core candidates in Table A.1. From top to bottom and then from left to right, the spectra are ordered in integrated intensity, with CRA 047 being the strongest. The spectra have also been displaced in intensity by multiples of 2 K and centered at 0 LSR velocity, for a comparison. Note that the spectra of the first ten objects have been divided by factors of between 6 and 2 (see labels) for clarity. Asterisks next to the names indicate the association with a YSO. |
| In the text | |
|
Fig. 2 Spectra of N2D+ (4–3) toward the whole sample of pre-stellar core candidates in Table A.1. The spectra follow the same order as in Fig. 1. The spectra have also been displaced in intensity by multiples of 2 K and centered at 0 LSR velocity, to allow for a comparison. Note that the spectrum of Oph 464 has been divided by a factor of 3 (see label) for clarity. |
| In the text | |
|
Fig. 3 Comparison of centroid velocities (vLSR) and line widths (FWHM) of the N2D+ (4–3) and N2H+ (3–2) lines. The different colors represent different molecular cloud complexes: Corona Australis (blue), Ophiuchus (red), Lupus (black). The stars show the cores associated with YSOs. The 1:1 correlation line is shown in dashed black. |
| In the text | |
|
Fig. 4 N2H+ deuterium fraction (RD ≡ N(N2D+)/N(N2H+) column density ratio) obtained from the N2D+ (4–3) and N2H+ (3–2) lines using constant excitation temperature analysis, as a function of H2 column density, N(H2), from Herschel data. The different colors represent different molecular cloud complexes: Corona Australis (blue), Ophiuchus (red), Lupus (black). The stars show the cores associated with YSOs. |
| In the text | |
|
Fig. 5 H2 volume density (nH2) versus kinetic temperature (Tkin) traced by the N2H+ (5–4)/(3–2) line flux ratio and based on the RADEX non-LTE code (van der Tak et al. 2007). The objects where this flux ratio was possible to measure are indicated in the figure by the labeled gray curves. The curves are dashed if Tkin > Tdust and full if Tkin < Tdust, where Tdust is the dust temperature measured with Herschel (see Table A.1). |
| In the text | |
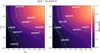 |
Fig. 6 Same as Figure 5 but for the N2D+ (4–3)/(3–2) line flux ratio. |
| In the text | |
|
Fig. C.1 Spectra of N2D+ (3-2), N2H+ (5-4), and N2D+ (6-5) toward a subsample of 23 pre-stellar core candidates. From top to bottom, the spectra follow the same order as in Fig. 1. The spectra have also been displaced in intensity by 2 K and centered at 0 LSR velocity, to allow for a comparison. Note that some spectra have been divided or multiplied by factors of 2 to 5 (see labels) for clarity. |
| In the text | |
Current usage metrics show cumulative count of Article Views (full-text article views including HTML views, PDF and ePub downloads, according to the available data) and Abstracts Views on Vision4Press platform.
Data correspond to usage on the plateform after 2015. The current usage metrics is available 48-96 hours after online publication and is updated daily on week days.
Initial download of the metrics may take a while.