Fig. 4
Download original image
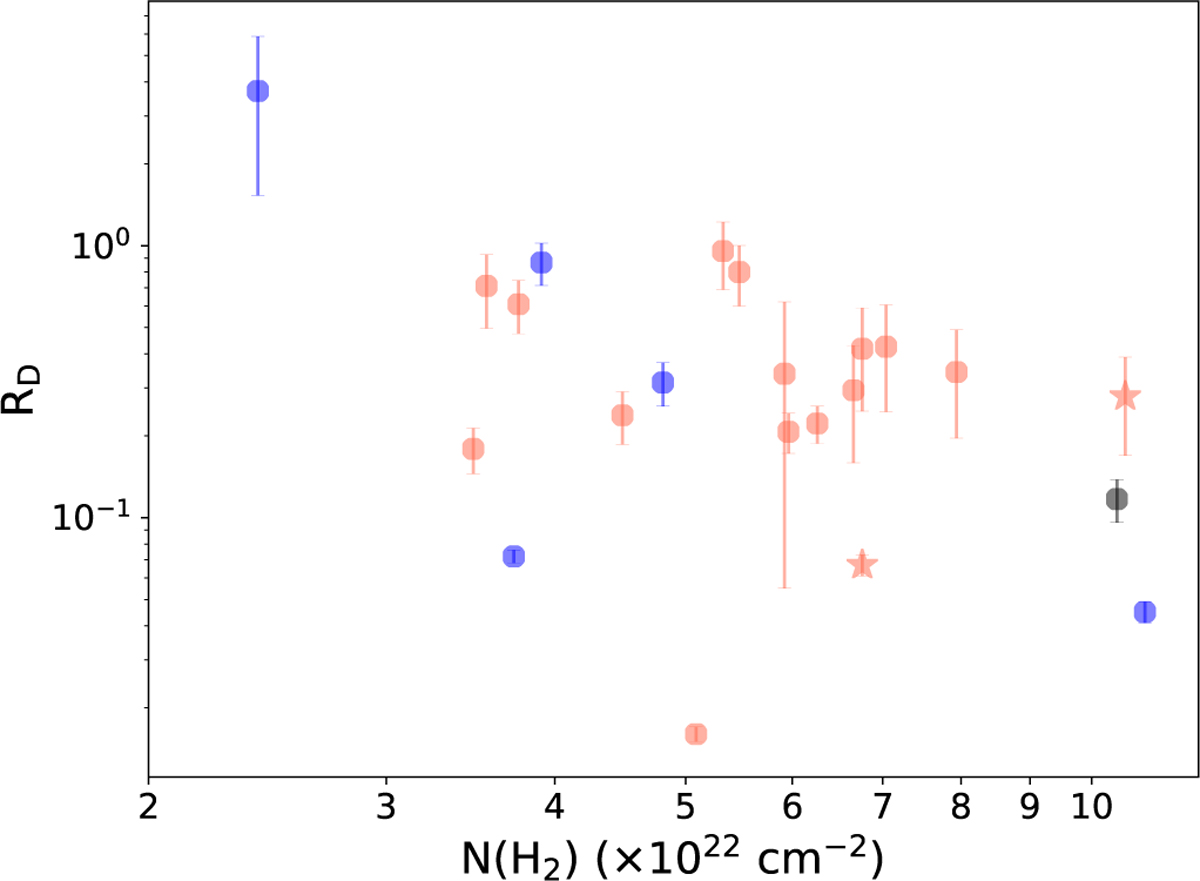
N2H+ deuterium fraction (RD ≡ N(N2D+)/N(N2H+) column density ratio) obtained from the N2D+ (4–3) and N2H+ (3–2) lines using constant excitation temperature analysis, as a function of H2 column density, N(H2), from Herschel data. The different colors represent different molecular cloud complexes: Corona Australis (blue), Ophiuchus (red), Lupus (black). The stars show the cores associated with YSOs.
Current usage metrics show cumulative count of Article Views (full-text article views including HTML views, PDF and ePub downloads, according to the available data) and Abstracts Views on Vision4Press platform.
Data correspond to usage on the plateform after 2015. The current usage metrics is available 48-96 hours after online publication and is updated daily on week days.
Initial download of the metrics may take a while.