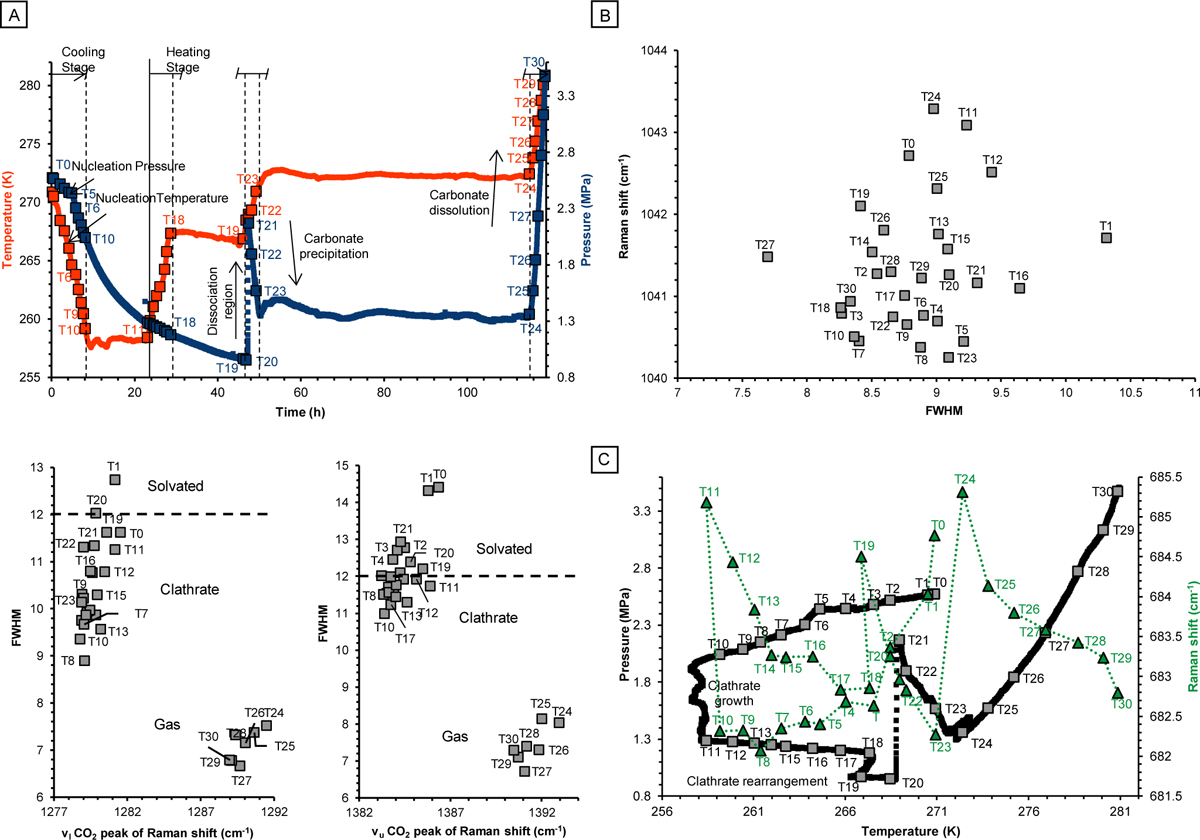
Fig. 4
Download original image
Monitoring results of Na-clathrite synthesis. Each pressure, temperature, and Raman measurement was labelled with the initial letter of ‘time’ in capital letters followed by a number in ascending order. (A) Top: pressure-temperature-time path diagram for CO2 clathrate hydrate formation-dissociation and carbonate precipitation, divided into two stages: cooling and heating. Breaks in experimentation, due to the end of the working day, are illustrated as interruptions in the timeline. Each square dot represents a Raman measurement labelled from T0 to T30, with T0 being the first measurement under closed system conditions. (A) Bottom: plot of Raman position of the lower (νl) and upper bands (νu) of the CO2 Fermi diads in the gas, solvated, and clathrate phase vs. the full width at half-maximum value. (B) Crystallisation of sodium carbonate phase for the stretching ν1 mode. (C) Bending ν4 mode positions of carbonate group on the CO2-clathrate hydrate formation-dissociation curve.
Current usage metrics show cumulative count of Article Views (full-text article views including HTML views, PDF and ePub downloads, according to the available data) and Abstracts Views on Vision4Press platform.
Data correspond to usage on the plateform after 2015. The current usage metrics is available 48-96 hours after online publication and is updated daily on week days.
Initial download of the metrics may take a while.