| Issue |
A&A
Volume 703, November 2025
|
|
|---|---|---|
| Article Number | A297 | |
| Number of page(s) | 10 | |
| Section | Planets, planetary systems, and small bodies | |
| DOI | https://doi.org/10.1051/0004-6361/202556029 | |
| Published online | 26 November 2025 | |
The formation of clathrites under planetary conditions of ocean worlds: The case of Ceres and implications for future missions
1
Centro de Astrobiología (CAB), CSIC-INTA,
Carretera de Ajalvir km 4,
28850
Torrejón de Ardoz,
Madrid,
Spain
2
Tecvolrisk Research Group, Departamento de Biología, Geología, Física y Química Inorgánica, Universidad Rey Juan Carlos,
Calle Tulipán s/n,
28933
Móstoles,
Madrid,
Spain
3
Universidad de Valladolid – Grupo ERICA,
Avda. Francisco Valles n° 8,
47151
Parque Tecnológico de Boecillo,
Spain
★ Corresponding authors: This email address is being protected from spambots. You need JavaScript enabled to view it.
; This email address is being protected from spambots. You need JavaScript enabled to view it.
Received:
19
June
2025
Accepted:
4
October
2025
Abstract
Carbonates have been identified on the surfaces of several ocean worlds, although their formation processes remain poorly understood and are currently the subject of debate. Theoretical models have suggested the presence of clathrate hydrates in the subsurface of these ocean worlds and their dissociation could not only trigger the formation of certain kinds of surface geological features, but also contribute to the precipitation of authigenic carbonates emplaced on them. These authigenic carbonates, when derived from clathrate hydrate dissociation, are known as clathrites, which, to date, have only been reported on Earth along continental margins where clathrate hydrate deposits are present. In this work, we investigated whether the hypothetical precipitation of planetary clathrites could occur through the reaction between carbon molecules released after clathrate hydrate dissociation and brines or cryomagmas. We reproduced experimentally the formation process of clathrites from CO2-clathrate hydrates, monitoring in situ formation with Raman spectroscopy, and additionally characterised the mineral products ex situ by X-ray diffraction and IR spectroscopy. Here we show that carbon can be transferred from the dissociated clathrate hydrate molecules to the forming carbonates under the temperature-pressure conditions of the subsurface of ocean worlds. These high-pressure experimental results demonstrate that clathrites can form under crustal conditions of ocean worlds and that a genesis linked to clathrate hydrates should be considered, if the occurrence of these phases in the subsurface cannot be ruled out.
Key words: minor planets, asteroids: general / planets and satellites: composition / planets and satellites: oceans / planets and satellites: surfaces
© The Authors 2025
 Open Access article, published by EDP Sciences, under the terms of the Creative Commons Attribution License (https://creativecommons.org/licenses/by/4.0), which permits unrestricted use, distribution, and reproduction in any medium, provided the original work is properly cited.
This article is published in open access under the Subscribe to Open model. This email address is being protected from spambots. You need JavaScript enabled to view it. to support open access publication.
1 Introduction
Ocean worlds that harbour subsurface oceans and/or shallow liquid reservoirs within their icy crusts provide the ideal thermodynamic conditions of low temperature and high pressure for the formation and stability of clathrate hydrates (Mousis et al. 2015). Clathrate hydrates are crystalline water-based cage-like structures formed from the sequestration of gas compounds, many of which, such as CH4, CO2, and H2S, are essential for life or are involved in biological processes. As such, they can be considered potential reservoirs of life-supporting molecules.
Theoretical geophysical and chemical models suggest the existence of clathrate hydrates on the subsurface ice and ocean (e.g., Prieto-Ballesteros et al. 2005; Castillo-Rogez et al. 2019; Kamata et al. 2019; Vu et al. 2020; Boström et al. 2021), but their presence remains unconfirmed due to the current lack of direct observational evidence, in particular from subsurface radar data. This may change with the arrival of upcoming missions such as the European Space Agency’s (ESA) Jupiter Icy Moons Explorer (JUICE) with the Radar for Icy Moon Exploration (RIME) instrument and the National Aeronautics and Space Administration’s (NASA) Europa Clipper equipped with the Radar for Europa Assessment and Sounding: Ocean to Near-surface (REASON) instrument, which will explore Europa’s subsurface. This will be followed by the proposed ESA L4 mission concept to Enceladus (Martins et al. 2024). Radar instruments will be able to detect electrical conductivity and permittivity signals that are consistent with the presence of clathrate hydrates (Pettinelli et al. 2015; Stern et al. 2021; Ercilla Herrero et al. 2022).
Although their existence is only currently supported by theoretical models, clathrate hydrates may help explain several key aspects of ocean worlds. Their insulating properties would contribute to the preservation of shallow liquid reservoirs, as suggested for Ceres (Castillo-Rogez et al. 2019), and possibly even to the maintenance of an entire subsurface ocean, such as that proposed for Pluto (Kamata et al. 2019). In addition, their formation and dissociation might have contributed to the triggering of certain geological processes that might potentially influence the mineralogical composition of surface deposits as well as the formation of some geological structures. Some examples include the alteration of the hydrocarbon composition in Titan’s lakes, where methane enclathration and subsequent substitution by ethane within alkanofers may influence lake hydrocarbon chemistry (Choukroun & Sotin 2012; Mousis et al. 2016); while the dissociation process could have driven cryovolcanism on Titan (Choukroun et al. 2010) and Europa (Kargel et al. 2000), and geyser-like activity on Enceladus (Bouquet et al. 2015) and potentially Europa (Shibley & Laughlin 2021), and may even have induced the formation of Europa’s chaotic terrains (Kargel et al. 2003). In addition, they could serve as conduits for material exchange between internal layers. This would have significant implications for habitability by enabling the downward transport of radiolytic oxidants to subsurface environments on Europa (Hand et al. 2006), or by channelizing life-supporting volatiles from the rocky mantle to the multi-layered ocean on Ganymede (Izquierdo-Ruiz et al. 2020).
One aspect that is overlooked in planetary science literature, although it has been studied in terrestrial cold seep environments, is the interaction between carbon-containing gases, which are released by the dissociation of clathrate hydrates, and cations, which are present in marine sediment pore waters; this interaction leads to the precipitation of carbonate minerals that are isotopically enriched in oxygen-18. This isotopic signature has been used to date such an event (Bohrmann et al. 1998) since on Earth clathrate hydrates tend to select heavy water from pore waters to form their crystalline water structures (Hachikubo et al. 2007).As a result, those authigenic carbonates that were precipitated after clathrate hydrate dissociation and whose carbon came from gas molecules that had been enclathrated were termed clathrites by Kennett & Fackler-Adams (2000) and Bohrmann et al. (2002). This process represents a distinct pathway of carbonate formation directly linked to clathrate hydrate dissociation; however, it should be noted that on Earth, biological activity is involved in promoting their precipitation (Carrizo et al. 2022). Similarly, such clathrites might also form abiotically on ocean worlds when gases released by clathrate hydrate dissociation dissolve into the liquid phase of the ascending plumes of Enceladus, or into cryomagmas of Europa, subsequently reacting with dissolved cations. Moreover, on modern Ceres, gases released from dissociated clathrate hydrates, which initially formed during the subsurface ocean freezing stage (Formisano et al. 2020), could have chemically interacted with the volatile compounds and salts within brine reservoirs or ascending cryomagmas. At this stage, accurate mineralogical and geochemical analyses are essential to distinguish clathrites from other carbonates of a different genesis. The identification of clathrites would imply the involvement of clathrate hydrates, both in the mineral precipitation process (evidenced by an isotopic signature with a high 18OZ16O ratio and lower crystallinity; e.g. Bohrmann et al. 1998, 2002; Carrizo et al. 2022; de Dios-Cubillas et al. 2024) and in the potential influence on the formation of the geological structure in which they are emplaced.
Nevertheless, this scenario is not incompatible with carbonate formation through other geological processes previously proposed for Ceres, such as post-impact hydrothermal mineralisation (Zolotov 2017; Castillo-Rogez et al. 2018) and fractional cryomagmatic crystallisation (Neveu & Desch 2015). In fact, it should be noted that terrestrial clathrite rocks often contain the carbonate mineral phase that biogenically syn-precipitated with clathrate hydrates, and that is subsequently found alongside the carbonate phase formed after clathrate hydrate dissociation (see the petrographic relationship described in Bohrmann et al. 1998; de Dios-Cubillas et al. 2024).
The aim of this research is to investigate the possible formation of clathrites under the geophysical conditions and geochemistry of aqueous environments located within the ice crust of ocean worlds. Discussion section places particular focus on the potential formation of clathrites on Ceres, where Castillo-Rogez et al. (2019) propose that clathrate hydrate deposits could be abundant based on geophysical and geological observations as well as geochemical models, and where carbonate deposits associated with cryovolcanic dome-like features have been identified, such as at Cerealia Tholus within the Occator crater, Ahuna Mons adjacent to Crater B, and Liberalia Mons intersected by the Xevioso crater in its southern part (Fig. 1) (Carrozzo et al. 2018; Sori et al. 2018; McCord & Zambon 2019; Scully et al. 2020).
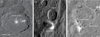 |
Fig. 1 Cryovolcanic features on Ceres' surface. The materials that form Cerealia Tholus (A), Ahuna Mons (B), and the exposed parts of Liberalia Mons (C), revealed by the impact of the Xevioso crater, are notable for their bright colour spectrum, which contrasts sharply with the darker tones of the average surface of Ceres. Credit: NASAZJPL-CaltechZUCLAZMPSZDLRZIDAZPSI. Image numbers: PIA20350 and PIA21907. |
2 Methodology
Interpretations of infrared spectral data acquired from Europa’s surface by the Galileo’s Near Infrared Mapping Spectrometer (NIMS), Ceres' surface by the Dawn’s Visible and Infrared Spectrometer (VIR), and mass spectral data from Enceladus' plumes by the Cassini’s Cosmic Dust Analyzer (CDA), suggest the presence of carbonates bound to three principal cations: Ca, Mg and Na. These include minerals species such as natron (Na2CO3 · 10H2O) in Europa’s low albedo material (McCord et al. 1999), natrite (Na2CO3) and its hydrated phase, nahcolite (NaHCO3), in the water-ice particle ejected from Enceladus (Postberg et al. 2009), and signatures consistent with calcite (CaCO3), dolomite (MgCa(CO3)2), magnesite (MgCO3), natrite, and nahcolite on Ceres (Carrozzo et al. 2018; Raponi et al. 2019, 2021). On this basis, we conducted three clathrite synthesis experiments for each of the cations present in the carbonates of the most promising and accessible ocean worlds for astrobio-logical research.
To simulate the temperature and pressure conditions that prevail in shallow subsurface reservoirs within the ice crust, we adopted benchmark values of 255 K and 3 MPa. These parameters are grounded in the physicochemical conditions inferred for ocean worlds based on geophysical and thermodynamic modelling. In particular, the selected pressure falls within the estimated range for Enceladus’ subsurface ocean (Hao et al. 2022) and is also comparable to the internal tensile stresses proposed to induce fracturing of its ice crust (Rudolph & Manga 2009). Moreover, such pressures are consistent with those expected in cryomagmatic chambers within the ice crust of ocean worlds, where higher temperatures maintained by a salt-rich chemical composition and the possible presence of clathrate hydrates in the form of xenoliths would promote the stability of the briny cryomagma (Hesse & Castillo-Rogez 2019; Pedone et al. 2021; Muñoz-Iglesias & Prieto-Ballesteros 2022).
For these experiments, we considered an ammonia-free cryomagma composed of an H2O-CO2-salt system, as this composition would have favoured the predominant formation of sulphates (Kargel 1992), which could have been the case on Europa due to the lack of evidence for the presence of ammonia (Fagents 2003). This contrasts with Ceres and Enceladus, where ammonia is identified (Waite et al. 2009; Ammannito & Ehlmann 2022). However, ammonia was excluded from the system because laboratory experiments have shown that it reacts with CO2 to form teschemacherite ((NH4)HCO3), while also allowing CO2-clathrate hydrates to coexist (Muñoz-Iglesias & Prieto-Ballesteros 2021).
2.1 Experimental set-up
The Ca-, Mg-, and Na-clathrite were synthesised using the same experimental setup described by Muñoz-Iglesias et al. (2019). We used a high-pressure simulation cell (HPSC) made of stainless steel, with a volume capacity of 67 ml. The HPSC is equipped with a thermocouple and a pressure sensor to monitor temperature and pressure parameters. It has a sapphire window at the front, which allows a Raman spectrometer to be coupled to analyse phase changes. The rear of the HPSC is connected to a CO2 bottle in order to provide both pressure and CO2 for the formation of clathrate hydrates from this CO2 guest molecule. The HPSC is surrounded by a tube through which a cooling fluid (a mixture of 40% Milli-Q and 60% CH3OH) is circulated to get the required planetary temperature.
2.2 Clathrite synthesis procedure
The same methodology was applied in the three experiments described below. In each experiment, a distinct composition of crushed ice was introduced into the cell, prepared from a frozen solution containing 7.4 wt% of the respective hydroxide compound - Ca(OH)2 for the Ca-clathrite, Mg(OH)2 for the Mg-clathrite, and NaOH for the Na-clathrite - diluted in Milli-Q water. The first step involved forming CO2 clathrate hydrates. To achieve this, we pressurised the system to 3 MPa and allowed it to saturate with CO2 for approximately three hours. An exception was made for the Na-clathrite synthesis experiment, which was left to saturate for a longer period due to the immediate reaction between NaOH (aq) and CO2 (g), evidenced by a pressure drop in the cell while the CO2 bottle remained open. After the saturation period, we locked the CO2 bottle, converting the experiment into a closed system, at the moment we started to monitor the experiment. We immediately lowered the temperature to 255 K to promote the formation of CO2-clathrate hydrates. Once their formation was achieved, we proceeded to the second step of the experiment by gradually increasing the temperature to induce the dissociation of clathrate hydrates and promote the precipitation of carbonates as clathrites. The heating was performed in three timed stages.
2.3 Data acquisition
Raman spectroscopy was the main in situ analytical measurement technique used to determine the chemical composition of the mineral phases in formation once the CO2 gas supply was cut off. We labelled the measurements with the letter ‘T’ followed by a sequential enumeration. Thus, the first measurement, which corresponds to the start time, was marked as T0. We used the iHR550 Raman spectrometer (Horiba Jobin Yvon, France), with a Nd:YAG laser excitation source at 532 nm. The scattered light was dispersed by a 1200 grooves/mm diffraction grating and detected by 1024 × 256 pixels CCD. Raman measurements were acquired with a spectral resolution of 0.103 nm in the spectral range 150-4000 cm−1, with an excitation power of 200 mW and exposure times varying from 80 to 250 seconds. Raman spectra were processed using OriginPro 2015 and SpectPro software, the latter developed by the University of Valladolid. The Raman peak positions and full width at half maximum (FWHM) were fitted using Lorentzian functions for the Raman bands of CO2 molecules, and Gaussian-Lorentzian or Gaussian functions for the less intense and more variable Raman bands of carbonates.
We corroborated the Raman results of the chemical composition of the synthesised clathrites outside the HPSC using two other analytical techniques, X-ray diffraction and IR-spectrosocopy, for which it was necessary to pulverise a fraction of the samples. The X-ray diffraction analysis was performed using a Bruker D8 Advance ECO Diffractometer, using CuKα radiation at 40 kV and 30 mA. Data were recorded in the 5-60° (2θ) range with an angular step size of 0.05°. X-ray diffractograms were analysed using the PDF-2 2002 database. For near-infrared (1-5 μm) and mid-infrared (4000-400 cm−1) characterisation, a Thermo Scientific Nicolet iS50 FT-IR spectrometer was used, equipped with a DTGS-KBr detector and quartz beamsplitter, respectively.
3 Results
3.1 Thermodynamic pathway and Raman signatures of clathrite synthesis
The results of the Raman spectroscopy monitoring of the synthesis of Ca-clathrite, Mg-clathrite, and Na-clathrite are shown in Figs. 2, 3, and 4, respectively. Each experiment started with pressurising of the cell to ∼3 MPa, followed by a cooling stage, and three-heating stages due to our working schedule.
After CO2 injection, the temperature was reduced to achieve the formation of CO2-clathrate hydrates. During the cooling stage, two pressure drops were observed. The first marked the nucleation of clathrate hydrates, which was also evidenced by Raman spectroscopy, where the Raman position of the lower (νι) and upper bands (νu) of the CO2 Fermi diads in the gas phase (approximately 1290 and 1390 cm−1) shifted to lower frequencies, indicating the transition from the clathrate hydrate phase. The second drop signalled the growth of clathrate hydrates, which was completed in the Ca-clathrite and Mg-clathrite formation experiments (Ca- and Mg-Exp) as indicated by the stabilisation of system pressure and temperature (Figs. 2AT0-T3, 3AT0-T2). On the other hand, in the Na-clathrite formation experiment (Na-Exp), CO2-clathrate hydrates continued to form even after the cooling temperature stabilised because the pressure did not remain constant (Fig. 4AT0-T11).
As in cold seep environments (Bohrmann et al. 1998, 2002), carbonate syn-precipitated along with the forming CO2-clathrate hydrates. The nucleation produced low quality carbonate microcrystals according to the high FWHM values of the Raman spectral peaks. In the Ca-Exp, Raman analysis revealed the characteristic carbonate band of an ikaite-calcite phase, which is identified by the weak and strong ν1 symmetric stretching bands at approximately 1070 cm−1 and 1086 cm−1 respectively (Fig. 2BT0-T3) (Sánchez-Pastor et al. 2016). In the Mg-Exp, it was classified as a hydrated amorphous Mg-carbonate due to its broad FWHM values (Fig. 3BT1-T2), whereas in the Na-Exp, it was classified as nahcolite (Hoshino et al. 2006) based on the position of the Raman bands at 685 cm−1 (Fig. 4CT0), 1043 cm−1 (Fig. 4BT0), and 1265 cm−1.
As cooling progressed and the processes of nucleation, growth, rearrangement, and stabilisation of CO2-clathrate hydrates took place, the Ca-Exp revealed that the ν4 bending mode of Ca-carbonate in synthesis shifted to higher frequencies (Figs. 2CT0-T3, 3CT1-T2). The shift observed here of about 20 cm−1 is larger than that reported for the ν4 bond of calcite, which is only about 0.06 cm−1 for a temperature increase of 15 K (Gillet et al. 1993). This shift may be related to a change in the molecular structure of carbonate, which could reflect an increase in molecular rigidity, likely acting as a mechanism to preserve its carbon in response to favourable CO2 sequestration within clathrate hydrates.
The cooling stage concluded with the formation of CO2-clathrate hydrates and the precipitation of carbonates. Then, the heating stage was initiated to promote the dissociation of CO2-clathrate hydrates, which led to the synthesis of clathrites from the carbon of the enclathrated CO2 molecules. We observed that the physico-chemical evolution of each experimental system throughout the three-heating stage followed different thermodynamic pathways.
In the initial third of the Ca-Exp heating stage, the temperature increase coincided with an increase in pressure (Fig. 2AT4-T8). The system reached conditions outside the clathrate hydrate stability zone, and CO2-clathrate hydrates began to destabilise and dissociate. During the heating pause, a slight decrease of both parameters would indicate a slow formation and rearrangement of clathrate hydrates (Fig. 2AT8-T9). In the second third, the pressure increase due to temperature was less pronounced compared to the previous heating interval, due to the thermal expansion of clathrate hydrates (Fig. 2AT10-T17). This slope became stepper in relation to clathrate hydrate dissociation. The subsequent sudden rise and drop in pressure was due to enhanced solvation of CO2 gas in water (Fig. 2AT17-T18). The presence of free CO2 ions from dissociated clathrate hydrates caused a decrease in the FWHM values of the carbonate symmetric stretch to about 7 cm−1 during heating, which indicates that the Ca-clathrite was achieving a medium-degree crystallinity (Fig. 2BT4-T21) (Toffolo et al. 2023). The ikaite band at 1070 cm−1, which corresponds to the hydrated calcium carbonate polymorph, disappeared due to its solubility above the freezing point, completing the transformation into the anhydrous calcium carbonate phase from T14 (Bohrmann et al. 2002).
In the Mg-Exp, the dissociation of CO2-clathrate hydrates coincided with a pressure drop caused by CO2 leakage from the cell (Fig. 3At3-t16). Due to the unstable conditions from depressurisation, the amorphous magnesium carbonate of the Mg-clathrite remained uncrystallised, given the high FWHM values (Fig. 3B) and the appearance and disappearance of distinct bending bands (~663 and 701 cm−1) (Fig. 3C).
As in the previous case, a pressure drop occurred during the initial heating of the Na-Exp (Fig. 4AT12-T18). The cooling stage ended with the continued formation of CO2-clathrate hydrates, which suggests that the pressure drop may have been caused by a structural rearrangement of the clathrate hydrate host network. However, with increasing temperature, CO2-clathrate hydrates reached a metastable state at T19-T20, from which they completely dissociated during the second third of the heating process, evidenced by a sudden upturn in pressure (Fig. 4AT20-T21). The melting and availability of dissolved CO2 enabled the clathrite in synthesis to sequester it, which led to another pressure drop (Fig. 4At22-t23). During the final heating phase, CO2 existed in a gaseous state (Fig. 4AT24-T30). A pressure increase was observed, likely due to the dissolution of carbonate from the formed Na-clathrite, the main possible contributing mineral to the CO2 emission in the system. The nahcolite bending band shifted to the highest frequencies three times, once during the cooling pause and twice during the heating pause (Fig. 4CT11,T19,T24). These phenomena suggest a hardening of the carbon-oxygen bond in nahcolite as a stabilisation mechanism under low pressure conditions, since nahcolite precipitates under high pressure conditions (Deocampo & Jones 2014). On the contrary, as observed in the Ca-Exp, the dissociation of CO2-clathrate hydrates resulted in characteristic low bending frequencies (Fig. 4CT12-T18,T20-T21). Furthermore, the dissolution of nahcolite due to temperature increase and thawing also caused the bending band to shift towards lower frequencies (Fig. 4CT22-T23). No changes in FWHM values were detected (Fig. 4B), which indicates that there is no optimisation in its crystallisation compared to the qualitative evaluation of the RRUFF nahcolite (5 cm−1) (Lafuente et al. 2016).
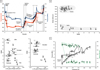 |
Fig. 2 Monitoring results of Ca-clathrite synthesis. Each pressure, temperature, and Raman measurement was labelled with the initial letter of ‘time’ in capital letters followed by a number in ascending order. (A) Top: pressure-temperature-time path diagram for CO2 clathrate hydrate formation-dissociation and carbonate precipitation, divided into two stages: cooling and heating. Breaks in experimentation, due to the end of the working day, are illustrated as interruptions in the timeline. Each square dot represents a Raman measurement labelled from T0 to T21, with T0 being the first measurement under closed system conditions. (B) Bottom: plot of Raman position of the lower (ν1) and upper bands (νu) of the CO2 Fermi diads in the gas, solvated, and clathrate phase vs. the full width at half-maximum value. B) Crystallisation of calcium carbonate phase for the stretching ν1 mode. (C) Bending ν4 mode positions of carbonate group on the CO2-clathrate hydrate formation-dissociation curve. |
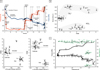 |
Fig. 3 Monitoring results of Mg-clathrite synthesis. Each pressure, temperature, and Raman measurement was labelled with the initial letter of ‘time’ in capital letters followed by a number in ascending order. (A) Top: pressure-temperature-time path diagram for CO2 clathrate hydrate formation-dissociation and carbonate precipitation, divided into two stages: cooling and heating. Breaks in experimentation, due to the end of the working day, are illustrated as interruptions in the timeline. Each square dot represents a Raman measurement labelled from T0 to T25, with T0 being the first measurement under closed system conditions. (A) Bottom: plot of Raman position of the lower (νl) and upper bands (νu) of the CO2 Fermi diads in the gas, solvated, and clathrate phase vs. the full width at half-maximum value. (B) Crystallisation of magnesium carbonate phase for the stretching ν1 mode. (C) Bending ν4 mode positions of carbonate group on the CO2-clathrate hydrate formation-dissociation curve. |
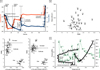 |
Fig. 4 Monitoring results of Na-clathrite synthesis. Each pressure, temperature, and Raman measurement was labelled with the initial letter of ‘time’ in capital letters followed by a number in ascending order. (A) Top: pressure-temperature-time path diagram for CO2 clathrate hydrate formation-dissociation and carbonate precipitation, divided into two stages: cooling and heating. Breaks in experimentation, due to the end of the working day, are illustrated as interruptions in the timeline. Each square dot represents a Raman measurement labelled from T0 to T30, with T0 being the first measurement under closed system conditions. (A) Bottom: plot of Raman position of the lower (νl) and upper bands (νu) of the CO2 Fermi diads in the gas, solvated, and clathrate phase vs. the full width at half-maximum value. (B) Crystallisation of sodium carbonate phase for the stretching ν1 mode. (C) Bending ν4 mode positions of carbonate group on the CO2-clathrate hydrate formation-dissociation curve. |
3.2 Mineralogical characterisation of synthesised clathrites
The synthesised clathrite samples are shown in Fig. 5A. Mineralogical analysis identified the Ca-clathrite as a calcitic clathrite, based on Raman spectroscopy (Fig. A.1) and X-ray diffraction patterns (Fig. A.2). Furthermore, the near- and mid-IR spectral signatures (Fig. 5B and Fig. A.3) match the characteristic reflectance bands of calcite reported in the literature (Hunt & Salisbury 1971; Gaffey 1986; Bishop et al. 2001; Ji et al. 2009).
In contrast, the amorphous metastable Mg-clathrite exhibited signs of recrystallisation upon exposure to room conditions, as evidenced by the unique presence of a ν1 -banded carbonate phase at 1100 cm−1 (Fig. A.1). X-ray diffraction identified it as a mixture of nesquehonite (MgCO3 · 3H2O), brucite (Mg(OH)2), and shelkovite (Mg7(CO3)5(OH)4 · 24H2O) (Fig. A.2). This polymineral composition matches the near-IR (Fig. 5B) and mid-IR spectra phases (Fig. A.3) (Chukanov 2013; Beck et al. 2015; Harner & Gilmore 2015; Lafuente et al. 2016).
The brucite phase identified was a neoformed secondary mineral, not derived from the initial brine solution used in the formation of CO2-clathrate hydrates. The MgOH used in the experiment exhibited three intense Raman bands at 280, 446, and 3657 cm−1 (Fig. 5C, left). The latter two overlapped with the signals from the sapphire window of the cell and the water curve, respectively. In particular, the 280 cm−1 band disappeared during the dissociation of CO2-clathrate hydrates, which indicates that Mg(OH)2 reacted with the released CO2 to form the Mg-clathrite (Fig. 5C, right).
The Na-clathrite is mainly nahcolite, as identified by Raman spectroscopy (Fig. A.1) and mid-IR spectroscopy (Fig. A.3) (Palayangoda & Nguyen 2012; Chukanov 2013), with a minor fraction of thermonatrite (Na2CO3 · H2O) (Fig. A.2). In the near-IR spectrum (Fig. 5B), the large slope with a flat appearance corresponds to nahcolite, with weak features observed at 1.88, 3.42, and 3.80 μm, which have been assigned to this phase (Crowley 1991; Harner & Gilmore 2015). The band at 2.04 μm is attributed to thermonatrite (Fastelli et al. 2021).
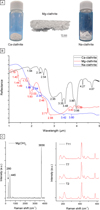 |
Fig. 5 Characterisation of the clathrite samples. (A) Images of the three synthesised clathrites. (B) Near-IR spectra of Ca-clathrite (black line), Mg-clathrite (red line), and Na-clathrite (blue line). (C) Characteristic Raman peaks of MgOH used in the Mg-clathrite synthesis experiment (left). Raman spectra of Mg-clathrite in formation at three different times. The disappearance of the peak around 280 cm−1 indicates the depletion of the initial MgOH (right). |
4 Discussion
4.1 Clathrate hydrate dissociation as a feasible origin of carbonate deposits on ocean worlds
These high-pressure simulation experiments have demonstrated that clathrites can form under the ice shell environmental conditions of ocean worlds, particularly in geological settings where carbon-bearing clathrate hydrates would act as a significant carbon reservoir, potentially contributing to the precipitation of carbonate upon dissociation.
Such a scenario is plausible for ocean worlds and should not be ruled out given the strong mineralogical resemblance between the synthesised clathrites and carbonate species identified on ocean worlds such as Enceladus and Ceres, as detailed in Section 2.
Results from Raman spectroscopy and X-ray diffraction proved significantly more effective in determining the mineral composition of the simulated clathrites than other techniques that are more commonly employed in orbital planetary exploration, such as near-IR spectroscopy. In the visible and nearinfrared region, carbonates exhibit two distinct spectral features at 3.4-3.5 μm and 3.9-4.0 μm (Bishop et al. 2021). However, the first reflectance band is often ambiguous due to spectral overlaps with phyllosilicates and organic compounds (Carrozzo et al. 2018), which complicates definitive identification. In contrast, Raman spectroscopy offers a more comprehensive method and enables the precise identification of different mineral phases, the detection of phase transitions, and the study of structure and crystallinity. In addition, it can approach isotopic compositions (Gillet et al. 1996), which helps to constrain possible biogenecity (Glamoclija et al. 2009), and provide insights into the temperature and pressure conditions of mineral formation (Gillet et al. 1993).
4.2 Clathrate hydrates as potential carbon source for Ceres' large carbonate reservoirs: The case of Cerealia Tholus
Cerealia Tholus is a dome located within the Occator Crater that is formed by the extrusion of bright materials whose deposition suggests a distinctive stratigraphic relation that appears to transition from a base enriched in Ca-Mg carbonates to progressively Na-carbonate-rich layers in the upper layers; these culminate in an assemblage with hydrohalite and ammonium chloride at the top and along the steeper northwestern flank of the dome (Raponi et al. 2019; De Sanctis et al. 2020). A curious aspect of these bright materials is their phyllosilicate content, dominated by Al-phyllosilicates (Longobardo et al. 2019; Raponi et al. 2019; Scully et al. 2021), which contrasts with the average composition of Ceres' surface, which is characterised by the ubiquitous presence of Mg- and NH4-bearing phyllosilicates (Ammannito et al. 2016).
This carbonate-chloride cryocrystallisation sequence appears to correlate with the precipitation sequence from an alkaline, bicarbonate-rich, and magnesium- and calcium-poor cryomagma, and might further suggest the presence of a substantial carbon reservoir within the cryomagma, likely supplied by the dissociation of CO2∕CH4 clathrate hydrates triggered by decompression and/or impact events. In this hypothetical model, clathrate hydrate dissociation would release carbon into the cryomagma, which would initially drive the rapid precipitation of Ca- and Mg-carbonates due to their low solubility compared to Na-carbonates, despite experimental evidence showing that Na-rich solutions are effective at capturing CO2. As calcium and magnesium cations become depleted, Na-carbonates would then precipitate under conditions of decreased carbon availability, leading to the formation of chloride salts.
In addition, the dissociation process of clathrate hydrates might help to explain the absence of phyllosilicates with interlayer cations on Cerealia Tholus, as this process might generate enough pore overpressures to devolatilize phyllosilicates, producing effects similar to those of dehydration induced by meteorite impact shock pressures (Boslough et al. 1980; Lange & Ahrens 1982), although significantly less energetic, on the order of several tens of megapascals, as suggested by Xu & Germanovich 2006, due to the volume expansion of clathrate hydrate-dissociated water in low-permeability deposits. Moreover, the presence of ammonium in the interlayers of Cerean phyllosilicates might inhibit water adsorption of phyllosilicates following clathrate hydrate dissociation, thereby limiting their hydration swelling (Wang et al. 2022) and increasing pore pressure (Xu & Germanovich 2006). Under such conditions, elevated pore pressures would lead to partial compaction and the desorption of inter-layer water and cations (Israelachvili et al. 1988; Morrow et al. 2017), which could potentially result in the incorporation of Mg2+ and NH+4 into the cryomagma.
Dawn’s infrared spectral data show a positive correlation between the carbonate species identified on Cerealia Tholus and the mineral composition of synthesised clathrites, with nahcolite proposed as a candidate phase that best fits the observations (Raponi et al. 2021). Our findings indicate that carbonate precipitation subsequent to clathrate hydrate dissociation constitutes a plausible mechanism for the formation of the observed carbonate assemblages, although alternative pathways previously proposed remain valid. Furthermore, chemical equilibrium models revealed that nahcolite and thermonatrite might be stable in the shallow subsurface (Zolotov 2017), precisely where clathrate hydrates are suspected to coexist (Bland et al. 2016).
5 Conclusions
The experimental results show that Ceres' carbonates might indeed have originated from clathrate hydrates; similarly, clathrites could also be present on the surfaces of other ocean worlds, provided that the mechanisms responsible for their genesis involved the formation and dissociation of clathrate hydrates. High-pressure experimental observations support the precipitation of authigenic carbonates as clathrites, which highlights the favourable role of clathrate hydrates in carbon-bearing gas sequestration versus carbonate precipitation. Therefore, a thorough mineralogical and geochemical characterisation of planetary authigenic carbonate samples is essential, for which isotopic analysis and micro-Raman spectroscopy are valuable techniques to evaluate a possible genesis linked to the presence of clathrate hydrates.
Nevertheless, it should be noted that the mineral composition of planetary authigenic carbonates may have undergone mineral alteration, as observed in the synthesised clathrites. The reaction between the carbon gas molecules released by the dissociation of CO2-clathrate hydrates and cations present in the cryomagmatic solution would give rise to the first hydrated carbonate precipitates, whose metastability would be subject to the physico-chemical evolution of the cryomagmatic system. Processes such as depressurisation or exposure to space conditions after extrusion could promote their transformation into more stable mineral phases.
In this context, a future sample return mission is essential for carrying out the detailed petrographic, isotopic, and geochemical analyses necessary to distinguish clathrites from carbonates formed through other processes. To ensure the success of such a mission, it is crucial to propose instruments such as ground-penetrating radar, which are capable of identifying subsurface clathrate hydrate deposits as well as their possible relation with subsurface geological structures and cryomagmatic features observed on the surface. This would allow for the targeted collection of diverse carbonate samples, both those inferred to be associated and not associated with clathrate hydrate formation and dissociation processes, thereby increasing the scientific value of isotopic and mineralogical research.
Acknowledgements
This work is funded by Grant MDM-2017-0737 Unidad de Excelencia “María de Maeztu” Centro de Astrobiología (CAB, CSIC-INTA), Grant PID2019-107442RB-C32, PID2022-142490OB-C31 funded by MCIN/AEI/10.13039/501100011033 and, as appropriate, by “ERDF A way of making Europe”, by the “European Union” or by the “European Union NextGen-erationEU/PRTR”. We would like to thank Dr. Victoria Muñoz-Iglesias for her input on the use of hydroxide reactants.
References
- Ammannito, E., & Ehlmann, B. 2022, Ammonia on Ceres, eds. S. Marchi, C. A. Raymond, & C. T. Russell, Cambridge Planetary Science (Cambridge University Press), 134 [Google Scholar]
- Ammannito, E., DeSanctis, M. C., Ciarniello, M., et al. 2016, Science, 353, aaf4279 [NASA ADS] [CrossRef] [Google Scholar]
- Beck, P., Schmitt, B., Cloutis, E. A., & Vernazza, P. 2015, Icarus, 257, 471 [Google Scholar]
- Bishop, J. L., Lougear, A., Newton, J., et al. 2001, Geoch. Cosmochim. Acta, 65, 2875 [Google Scholar]
- Bishop, J. L., King, S. J., Lane, M. D., et al. 2021, Earth Space Sci., 8, e2021EA001844 [Google Scholar]
- Bland, M. T., Raymond, C. A., Schenk, P. M., et al. 2016, Nat. Geosci., 9, 538 [NASA ADS] [CrossRef] [Google Scholar]
- Bohrmann, G., Greinert, J., Suess, E., & Torres, M. 1998, Geology, 26, 647 [Google Scholar]
- Bohrmann, G., Suess, E., Greinert, J., Teichert, B., & Naehr, T. 2002, in Proceedings of 4th International Conference of Gas Hydrates, Yokohama, Japan, 102 [Google Scholar]
- Boslough, M. B., Weldon, R. J., & Ahrens, T. J. 1980, Lunar Planet. Sci. Conf. Proc., 3, 2145 [Google Scholar]
- Boström, M., Esteso, V., Fiedler, J., et al. 2021, A&A, 650, A54 [NASA ADS] [CrossRef] [EDP Sciences] [Google Scholar]
- Bouquet, A., Mousis, O., Waite, J. H., & Picaud, S. 2015, Geophys. Res. Lett., 42, 1334 [Google Scholar]
- Carrizo, D., de Dios-Cubillas, A., Sánchez-García, L., López, I., & PrietoBallesteros, O. 2022, Astrobiology, 22, 552 [Google Scholar]
- Carrozzo, F. G., Sanctis, M. C. D., Raponi, A., et al. 2018, Sci. Adv., 4, e1701645 [NASA ADS] [CrossRef] [Google Scholar]
- Castillo-Rogez, J., Neveu, M., McSween, H. Y., et al. 2018, Meteor. Planet. Sci., 53, 1820 [NASA ADS] [CrossRef] [Google Scholar]
- Castillo-Rogez, J. C., Hesse, M. A., Formisano, M., et al. 2019, Geophys. Res. Lett., 46, 1963 [Google Scholar]
- Choukroun, M., & Sotin, C. 2012, Geophys. Res. Lett., 39, L04201 [Google Scholar]
- Choukroun, M., Grasset, O., Tobie, G., & Sotin, C. 2010, Icarus, 205, 581 [Google Scholar]
- Chukanov, N. V. 2013, Infrared Spectra of Mineral Species: Extended Library (Dordrecht: Springer Science and Business Media) [Google Scholar]
- Crowley, J. K. 1991, J. Geophys. Res. Solid Earth, 96, 16231 [Google Scholar]
- de Dios-Cubillas, A., Prieto-Ballesteros, O., Nachtnebel, M., Fitzek, H., & Schröttner, H. 2024, J. Raman Spectrosc., 55, 1057 [Google Scholar]
- De Sanctis, M. C., Ammannito, E., Raponi, A., et al. 2020, Nat. Astron., 4, 786 [CrossRef] [Google Scholar]
- Deocampo, D., & Jones, B. 2014, in Treatise on Geochemistry, 2nd edn., eds. H. D. Holland, & K. K. Turekian (Oxford: Elsevier), 437 [Google Scholar]
- Ercilla Herrero, O., Sanchez-Benitez, J., Muñoz-Iglesias, V., & PrietoBallesteros, O. 2022, in European Planetary Science Congress, EPSC2022-438 [Google Scholar]
- Fagents, S. A. 2003, J. Geophys. Res.: Planets, 108, 5139 [Google Scholar]
- Fastelli, M., Zucchini, A., Comodi, P., et al. 2021, Minerals, 11 [Google Scholar]
- Formisano, M., Federico, C., Castillo-Rogez, J., De Sanctis, M. C., & Magni, G. 2020, MNRAS, 494, 5704 [Google Scholar]
- Gaffey, S. J. 1986, Am. Mineralogist, 71, 151 [Google Scholar]
- Gillet, P., Biellmann, C., Reynard, B., & McMillan, P. 1993, Phys. Chem. Miner., 20, 1 [Google Scholar]
- Gillet, P., McMillan, P., Schott, J., Badro, J., & Grzechnik, A. 1996, Geochim. Cosmochim. Acta, 60, 3471 [Google Scholar]
- Glamoclija, M., Steele, A., Fries, M., et al. 2009, in The ICDP-USGS Deep Drilling Project in the Chesapeake Bay impact structure: Results from the Eyreville Core Holes (Geological Society of America) [Google Scholar]
- Hachikubo, A., Kosaka, T., Kida, M., et al. 2007, Geophys. Res. Lett., 34, L21502 [Google Scholar]
- Hand, K. P., Chyba, C. F., Carlson, R. W., & Cooper, J. F. 2006, Astrobiology, 6, 463 [Google Scholar]
- Hao, J., Glein, C. R., Huang, F., et al. 2022, PNAS, 119, e2201388119 [Google Scholar]
- Harner, P. L., & Gilmore, M. S. 2015, Icarus, 250, 204 [Google Scholar]
- Hesse, M. A., & Castillo-Rogez, J. C. 2019, Geophys. Res. Lett., 46, 1213 [Google Scholar]
- Hoshino, K., Nagatomi, A., Watanabe, M., Okudaira, T., & Beppu, Y. 2006, J. Mineral. Petrol. Sci., 101, 254 [Google Scholar]
- Hunt, G. R., & Salisbury, J. W. 1971, Mod. Geol., 2, 23 [Google Scholar]
- Israelachvili, J. N., McGuiggan, P. M., & Homola, A. M. 1988, Science, 240, 189 [Google Scholar]
- Izquierdo-Ruiz, F., Recio, J. M., & Prieto-Ballesteros, O. 2020, ACS Earth Space Chem., 4, 2121 [Google Scholar]
- Ji, J., Ge, Y., Balsam, W., Damuth, J. E., & Chen, J. 2009, Mar. Geol., 258, 60 [Google Scholar]
- Kamata, S., Nimmo, F., Sekine, Y., et al. 2019, Nat. Geosci., 12, 407 [Google Scholar]
- Kargel, J. S. 1992, Icarus, 100, 556 [NASA ADS] [CrossRef] [Google Scholar]
- Kargel, J. S., Kaye, J. Z., Head, J. W., et al. 2000, Icarus, 148, 226 [NASA ADS] [CrossRef] [Google Scholar]
- Kargel, J. S., Prieto-Ballesteros, O., & Tanaka, K. L. 2003, in EGS - AGU - EUG Joint Assembly, 14252 [Google Scholar]
- Kennett, J. P., & Fackler-Adams, B. N. 2000, Geology, 28, 215 [Google Scholar]
- Lafuente, B., Downs, R. T., Yang, H., & Stone, N. 2016, 1. The Power of Databases: The RRUFF Project, eds. T. Armbruster, & R. M. Danisi (Berlin, München, Boston: De Gruyter (O)), 1 [Google Scholar]
- Lange, M. A., & Ahrens, T. J. 1982, J. Geophys. Res.: Solid Earth, 87, A451 [Google Scholar]
- Longobardo, A., Palomba, E., Carrozzo, F., et al. 2019, Icarus, 318, 205 [Google Scholar]
- Martins, Z., Bunce, E., Grasset, O., et al. 2024, Moons Giant Planets, 1 [Google Scholar]
- McCord, T. B., & Zambon, F. 2019, Icarus, 318, 2, The Composition of Ceres [Google Scholar]
- McCord, T. B., Hansen, G. B., Matson, D. L., et al. 1999, J. Geophys. Res.: Planets, 104, 11827 [Google Scholar]
- Morrow, C. A., Moore, D. E., & Lockner, D. A. 2017, J. Geophys. Res.: Solid Earth, 122, 3392 [Google Scholar]
- Mousis, O., Chassefière, E., Holm, N. G., et al. 2015, Astrobiology, 15, 308 [Google Scholar]
- Mousis, O., Lunine, J. I., Hayes, A. G., & Hofgartner, J. D. 2016, Icarus, 270, 37 [NASA ADS] [CrossRef] [Google Scholar]
- Muñoz-Iglesias, V., & Prieto-Ballesteros, O. 2021, ACS Earth Space Chem., 5, 2626 [Google Scholar]
- Muñoz-Iglesias, V., & Prieto-Ballesteros, O. 2022, ACS Earth Space Chem., 6, 1482 [Google Scholar]
- Muñoz-Iglesias, V., Prieto-Ballesteros, O., & López, I. 2019, J. Geophys. Res.: Planets, 124, 2660 [Google Scholar]
- Neveu, M., & Desch, S. J. 2015, Geophys. Res. Lett., 42, 10, 197 [Google Scholar]
- Palayangoda, S. S., & Nguyen, Q. P. 2012, Oil Shale, 29, 344 [Google Scholar]
- Pedone, M., Ammannito, E., Plainaki, C., et al. 2021, Brines Sol. Syst. Mod. Brines, 2614, 6010 [Google Scholar]
- Pettinelli, E., Cosciotti, B., Di Paolo, F., et al. 2015, Rev. Geophys., 53, 593 [Google Scholar]
- Postberg, F., Kempf, S., Schmidt, J., et al. 2009, Nature, 459, 1098 [Google Scholar]
- Prieto-Ballesteros, O., Kargel, J. S., Fernández-Sampedro, M., et al. 2005, Icarus, 177, 491 [Google Scholar]
- Raponi, A., De Sanctis, M., Carrozzo, F., et al. 2019, Icarus, 320, 83 [Google Scholar]
- Raponi, A., De Sanctis, M. C., Giacomo Carrozzo, F., et al. 2021, Life, 11 [Google Scholar]
- Rudolph, M. L., & Manga, M. 2009, Icarus, 199, 536 [Google Scholar]
- Sánchez-Pastor, N., Oehlerich, M., Astilleros, J. M., et al. 2016, Geochim. Cosmochim. Acta, 175, 271 [Google Scholar]
- Scully, J., Schenk, P., Castillo-Rogez, J., et al. 2020, Nat. Commun., 11, 3680 [Google Scholar]
- Scully, J. E. C., Baker, S. R., Castillo-Rogez, J. C., & Buczkowski, D. L. 2021, Planet. Sci. J., 2, 94 [Google Scholar]
- Shibley, N. C., & Laughlin, G. 2021, PSJ, 2, 221 [Google Scholar]
- Sori, M. M., Sizemore, H. G., Byrne, S., et al. 2018, Nat. Astron., 2, 946 [Google Scholar]
- Stern, L. A., Constable, S., Lu, R., Du Frane, W. L., & Roberts, J. J. 2021, Geophys. Res. Lett., 48, e2021GL093475 [Google Scholar]
- Toffolo, M. B., Pinkas, I., Gallo, A. Á., & Boaretto, E. 2023, Sci. Rep., 13, 12971 [Google Scholar]
- Vu, T., Choukroun, M., Sotin, C., Muñoz-Iglesias, V., & Maynard-Casely, H. 2020, Geophys. Res. Lett., 47, e2019GL086265 [Google Scholar]
- Waite, J. H., Lewis, W., Magee, B., et al. 2009, Nature, 460, 487 [NASA ADS] [CrossRef] [Google Scholar]
- Wang, X., Sun, Y., Peng, S., Wang, Y., & Li, S. 2022, J. Nat. Gas Sci. Eng., 108, 104836 [Google Scholar]
- Xu, W., & Germanovich, L. N. 2006, J. Geophys. Res.: Solid Earth, 111, B01104 [Google Scholar]
- Zolotov, M. Y. 2017, Icarus, 296, 289 [Google Scholar]
Appendix A X-ray diffraction and infrared spectral data
 |
Fig. A.1 Raman spectra of Ca-clathrite (A), Mg-clathrite (B) and Na-clathrite (C). |
 |
Fig. A.2 X-ray diffractograms of Ca-clathrite (A), Mg-clathrite (B) and Na-clathrite (C). |
 |
Fig. A.3 Mid-infrared spectra of Ca-clathrite (A), Mg-clathrite (B) and Na-clathrite (C). |
All Figures
|
Fig. 1 Cryovolcanic features on Ceres' surface. The materials that form Cerealia Tholus (A), Ahuna Mons (B), and the exposed parts of Liberalia Mons (C), revealed by the impact of the Xevioso crater, are notable for their bright colour spectrum, which contrasts sharply with the darker tones of the average surface of Ceres. Credit: NASAZJPL-CaltechZUCLAZMPSZDLRZIDAZPSI. Image numbers: PIA20350 and PIA21907. |
| In the text | |
|
Fig. 2 Monitoring results of Ca-clathrite synthesis. Each pressure, temperature, and Raman measurement was labelled with the initial letter of ‘time’ in capital letters followed by a number in ascending order. (A) Top: pressure-temperature-time path diagram for CO2 clathrate hydrate formation-dissociation and carbonate precipitation, divided into two stages: cooling and heating. Breaks in experimentation, due to the end of the working day, are illustrated as interruptions in the timeline. Each square dot represents a Raman measurement labelled from T0 to T21, with T0 being the first measurement under closed system conditions. (B) Bottom: plot of Raman position of the lower (ν1) and upper bands (νu) of the CO2 Fermi diads in the gas, solvated, and clathrate phase vs. the full width at half-maximum value. B) Crystallisation of calcium carbonate phase for the stretching ν1 mode. (C) Bending ν4 mode positions of carbonate group on the CO2-clathrate hydrate formation-dissociation curve. |
| In the text | |
|
Fig. 3 Monitoring results of Mg-clathrite synthesis. Each pressure, temperature, and Raman measurement was labelled with the initial letter of ‘time’ in capital letters followed by a number in ascending order. (A) Top: pressure-temperature-time path diagram for CO2 clathrate hydrate formation-dissociation and carbonate precipitation, divided into two stages: cooling and heating. Breaks in experimentation, due to the end of the working day, are illustrated as interruptions in the timeline. Each square dot represents a Raman measurement labelled from T0 to T25, with T0 being the first measurement under closed system conditions. (A) Bottom: plot of Raman position of the lower (νl) and upper bands (νu) of the CO2 Fermi diads in the gas, solvated, and clathrate phase vs. the full width at half-maximum value. (B) Crystallisation of magnesium carbonate phase for the stretching ν1 mode. (C) Bending ν4 mode positions of carbonate group on the CO2-clathrate hydrate formation-dissociation curve. |
| In the text | |
|
Fig. 4 Monitoring results of Na-clathrite synthesis. Each pressure, temperature, and Raman measurement was labelled with the initial letter of ‘time’ in capital letters followed by a number in ascending order. (A) Top: pressure-temperature-time path diagram for CO2 clathrate hydrate formation-dissociation and carbonate precipitation, divided into two stages: cooling and heating. Breaks in experimentation, due to the end of the working day, are illustrated as interruptions in the timeline. Each square dot represents a Raman measurement labelled from T0 to T30, with T0 being the first measurement under closed system conditions. (A) Bottom: plot of Raman position of the lower (νl) and upper bands (νu) of the CO2 Fermi diads in the gas, solvated, and clathrate phase vs. the full width at half-maximum value. (B) Crystallisation of sodium carbonate phase for the stretching ν1 mode. (C) Bending ν4 mode positions of carbonate group on the CO2-clathrate hydrate formation-dissociation curve. |
| In the text | |
|
Fig. 5 Characterisation of the clathrite samples. (A) Images of the three synthesised clathrites. (B) Near-IR spectra of Ca-clathrite (black line), Mg-clathrite (red line), and Na-clathrite (blue line). (C) Characteristic Raman peaks of MgOH used in the Mg-clathrite synthesis experiment (left). Raman spectra of Mg-clathrite in formation at three different times. The disappearance of the peak around 280 cm−1 indicates the depletion of the initial MgOH (right). |
| In the text | |
|
Fig. A.1 Raman spectra of Ca-clathrite (A), Mg-clathrite (B) and Na-clathrite (C). |
| In the text | |
|
Fig. A.2 X-ray diffractograms of Ca-clathrite (A), Mg-clathrite (B) and Na-clathrite (C). |
| In the text | |
|
Fig. A.3 Mid-infrared spectra of Ca-clathrite (A), Mg-clathrite (B) and Na-clathrite (C). |
| In the text | |
Current usage metrics show cumulative count of Article Views (full-text article views including HTML views, PDF and ePub downloads, according to the available data) and Abstracts Views on Vision4Press platform.
Data correspond to usage on the plateform after 2015. The current usage metrics is available 48-96 hours after online publication and is updated daily on week days.
Initial download of the metrics may take a while.